The main purpose of this ongoing blog will be to track planetary extreme, or record temperatures related to climate change. Any reports I see of ETs will be listed below the main topic of the day. I’ll refer to extreme or record temperatures as ETs (not extraterrestrials).😉
Main Topic: Global Warming Is Accelerating According to Doctor James Hansen
Dear Diary. The only debate of how fast and how bad that I will entail on this site continues between Dr. Michael Mann and Dr. James Hansen. Dr. Hansen has thrown down the gauntlet this week, coming up with more scientific reasons why he thinks that the average temperature of the planet is headed upward faster than during prior decades. The proof will be in the proverbial warming pudding. If averages remain near +1.5°C above preindustrial conditions through 2026 then move upward, Hansen has won the argument. If averages dip say near or below +1.3°C then slowly go up through 2030, Mann has won. regardless of who wins, humanity is in trouble in the long run through the end of this century.
Dr. Hansen’s most recent post is a bit technical but is an important read:
https://mailchi.mp/caa/2025-global-temperature
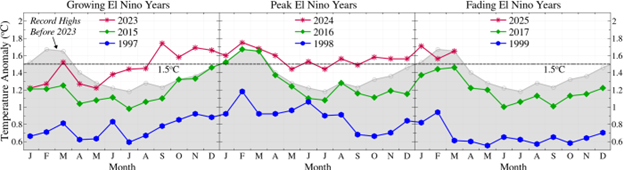
| Figure 1. Global Temperature Anomaly Near Past Three El Nino Events[1] |
| 2025 Global Temperature15 April 2025 James Hansen and Pushker Kharecha |
| Abstract. Global temperature for 2025 should decline little, if at all, from the record 2024 level. Absence of a large temperature decline after the huge El Nino-spurred temperature increase in 2023-24 will provide further confirmation that IPCC’s best estimates for climate sensitivity and aerosol climate forcing were both underestimates. Specifically, 2025 global temperature should remain near or above +1.5C relative to 1880-1920, and, if the tropics remain ENSO-neutral, there is good chance that 2025 may even exceed the 2024 record high global temperature. |
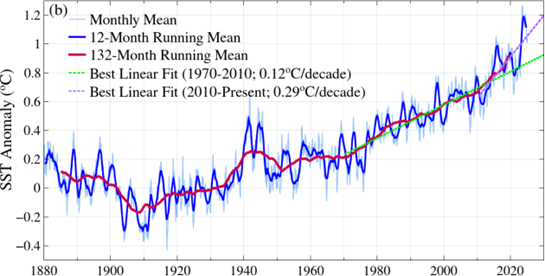
| Global temperature in February and March 2025 fell below the record highs for those months in 2024 (Fig. 1) and such relative decline is likely in most of the next few months. However, the decline has been modest and the 2024 vs 2025 ranks of several months later in the year might be reversed. Expectation of continuing global temperature change is aided by understanding of the accelerated global warming that began in about 2015. As noted in our “Acceleration” paper,[2] the leap of global temperature in 2023-24, in part, had an earlier origin. Interpretations of the 2023 warming are bookended by Raghuraman et al.[3] and Schmidt.[4] Raghuraman et al. conclude that the 2023 warming is explained by the El Nino, while Schmidt concludes that the extreme warming cannot be explained by even the full array of mechanisms in global models. Raghuraman et al. note that the 2023 El Nino rose from a deep La Nina, so, despite the El Nino being modest, the Nino3.4 (equatorial Pacific temperature used to characterize El Nino status) change may be sufficient to explain the extreme 2023-24 warming. Here, based on the Acceleration paper, we show that the El Nino accounts for only about half of the 2023-24 warming, and thus Schmidt is partially right: something else important is occurring. We first (Fig. 2a) remove the long-term trend of global temperature (0.18°C per decade) by subtracting it from the global temperature record since 1970. (The long-term trend is caused by the net greenhouse gas plus aerosol forcing.) What remains is the blue curve in Fig. 2a, which is global temperature change due to other forcings and natural variability. The main source of natural variability is the tropical El Nino cycle, shown by the temperature anomaly in the tropical Nino3.4 region (red curve). Thus, as a second step, we subtract the El Nino variability from the blue curve,[4] obtaining the green curve in Fig. 2b. Fingerprints of climate forcings are apparent in the green curve. Most obvious is the 0.3°C global cooling caused by the Pinatubo volcanic eruption, but even the maxima of solar irradiance (a forcing of only ± 0.12 W/m2) cause detectable warmings consistent with prior analyses.[6] |
| Figure 2. Detrended global and Nino3.4 temperatures (°C) and difference[7] |
 |
| The portion of the fingerprint of present interest is the decade-long anomaly that began in 2015 (Fig. 2b) and grew to an astounding +0.3°C in 2023. This warming anomaly does not coincide with reduction of aerosol emissions in China, which began in the first decade of the century and left a still highly polluted atmosphere in China. Instead, we associate most of the excessive warming with ship aerosol forcing, based on both the temporal and spatial coincidence of the warming and the aerosol forcing change.[2] Based on satellite-observed darkening (reduced Earth albedo – reflectivity – due to less cloud cover), we estimated a ship aerosol forcing of ~0.5 W/m2, with most of the forcing beginning in 2020 and occurring in the North Pacific and Atlantic regions between 35°N and 50°N. Global warming expected in 2023-24 from this forcing is ~0.2°C. The mid-latitude (35-50°N) sea surface temperature (SST) change associated with this forcing contributes as much to the 2023-24 global warming as the tropical El Nino warming (Fig. 3). That is why we project that global temperature decline in 2025 will be limited. |
| Figure 3. Zonal-Mean SST Anomaly (°C, Base Period = 1951-1980)[8] |
 |
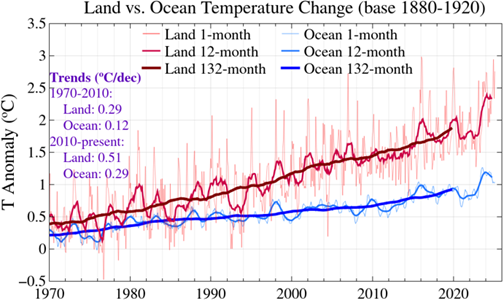
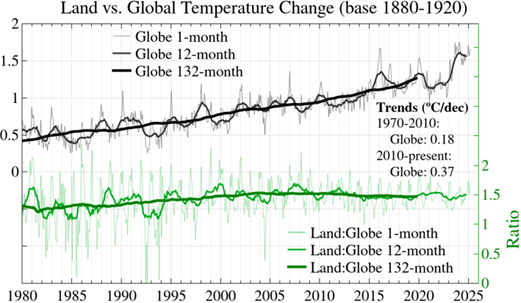
| Fig. 4. (top graph) Land and ocean temperature anomalies and (bottom graph) global temperature anomalies and the ratio of land to global anomalies. |
| Projected 2025 Global Temperature Anomaly. Expected global temperature change is affected by the natural seasonal cycle of global temperature change. As shown by the grey area in Fig. 1, temperature anomalies tend to be largest in Northern Hemisphere winter (Dec-Mar), which is a result of polar amplification of temperature change combined with the fact that anomalies are larger over land than over ocean and the fact that there is more land in the Northern Hemisphere than in the Southern Hemisphere. We will quantify these characteristics in the new data pages of our CSAS (Climate Science, Awareness and Solutions) web site. Here we illustrate the land, ocean, and global temperature changes for the period of rapid global warming, which is recent enough to minimize measurement error and to avoid divide by zero or negative numbers in taking ratios. The land temperature change is double the ocean temperature change (Fig. 4, top) and 1.5 times larger than the global temperature change (Fig. 4, bottom). Thus, present global warming of more than 1.5°C (2.7°F) is more than 2.25°C (4.05°F) where people live, i.e., on land. |
| Figure 5. (a) Global and (b) Sea Surface Temperatures (Base = 1880-1920) |
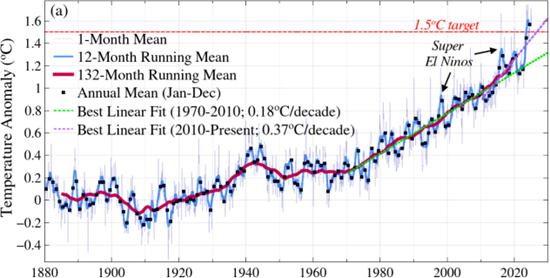
Global surface temperature has only slightly declined (Fig. 5a), even though global SST (sea surface temperature) declined substantially (Fig. 5b). The tropical Pacific was briefly in its cool (La Nina) phase in January 2025, but the La Nina was weak and the tropics are now ENSO[9]-neutral.[10] Global surface temperature averaged over 2025 will depend in part on how ENSO develops during 2025, but even if a La Nina reemerges, we expect 2025 global temperature to be at least +1.5°C relative to 1880-1920. How is that possible, given that global temperature usually declines substantially after an El Nino?
In part, the continued high global temperature is a result of high climate sensitivity. Climate response time (the time needed to realize the temperature change caused by a forcing) depends strongly on climate sensitivity.[11] If climate sensitivity is 3°C or less for doubled CO2, most of the early response to a forcing introduced in 2020 would be complete, the remaining response being “recalcitrant,” occurring over centuries and millennia, if the forcing remains in place that long. However, if climate sensitivity is as high as we have estimated (4.5°C ± 0.5°C, 1σ uncertainty) the ship aerosol forcing introduced in 2020 is still sufficiently fresh that the global response to it is still growing, as is the response to the current solar maximum. This should keep the 2025 global temperature competitive with the 2024 temperature, even though the tropics have cooled considerably (Fig. 6).
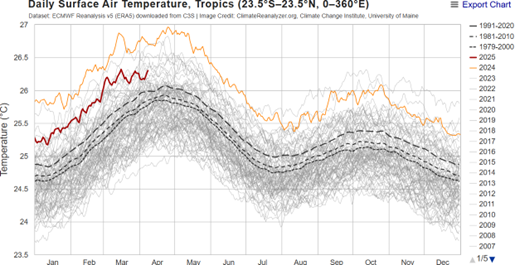
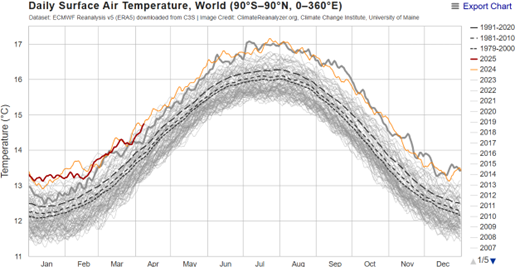
| Fig. 6. ECMWF Reanalysis v5 (ERA5) downloaded from C3S, Image Credit: ClimateReanalyzer.org, Climate Change Institute, University of Maine |
| Summary. Climate sensitivity and aerosol climate forcing are separate matters in climate physics. Unfortunately, because of the excessive reliance on GCMs (global climate models) in their climate assessments, IPCC inadvertently tied these two issues together, even employing “emergent constraints” on climate sensitivity and/or aerosol climate forcing to avoid model results going haywire. In our interpretation,[2] aerosol climate forcing grew (became more negative by about 0.5 W/m2) during the period of rapid global warming (1970-2005), which implies a high climate sensitivity (4.5°C ± 0.5°C, 1σ uncertainty) for best agreement with global warming of the past two centuries. Independent analyses of equilibrium paleoclimate states[12] and ongoing modern observations of climate processes yield a consistent conclusion of high climate sensitivity. These conclusions have significant implications for interpretation of climate change and climate policies. It is difficult to develop and present an alternative perspective – alternative to that of IPCC – when such an organization has been granted overwhelming authority and has grown a global army of disciples. We much appreciate support of our organization. |
[1] Temperature is from the Goddard Institute for Space Studies analysis described by NJL Lenssen et al., “A NASA GISTEMPv4 Observational Uncertainty Ensemble,” J. Geophys. Res. Atmos. 129, (2024) e2023JD040179, and J Hansen et al., “Global surface temperature change,” Rev. Geophys. 48, RG4004, 2010
[2] JE Hansen, P Kharecha, M Sato et al., Global warming has accelerated: are the United Nations and the public well-informed? Environment: Science and Policy for Sustainable Development, 67(1), 6–44, 2025, https://doi.org/10.1080/00139157.2025.2434494
[3] SP. Raghuraman et al., “The 2023 global warming spike was driven by the El Nino-Southern Oscillation,” Atmos. Phys. Chem. 24 (2024): 11,275-83
[4] G. Schmidt, “Why 2023’s heat anomaly is worrying scientists,” Nature 627 (2024): 467
[5] Nino3.4 temperature (equatorial Pacific temperature used to characterize El Nino status) is multiplied by 0.1 so that its variability about the zero line averages the same as the global temperature variability (Figure 2a). Global and Nino3.4 temperatures are highly correlated (56%) with global temperature lagging Nino3.4 by almost 5 months. Global cooling following the 1991 Pinatubo volcanic eruption and solar variability prevent higher correlation.
[6] K.K. Tung, J. Zhou, C.D. Camp, “Constraining model transient climate response using independent observations of solar-cycle forcing and response,” Geophys. Res. Lett. 35 (2008): L17707, doi:10.1029/2008GL034240
[7] Nino3.4 temperature is multiplied by 0.1 so that its variability about the zero line averages the same as the global temperature variability (Fig. 2a)
[8] SSTs are from the GISS temperature analysis, but these are obtained from NOAA, as explained in Reference 1
[9] ENSO = El Nino Southern Oscillation
[10] The notable “twin peaks” of SSTs in the WW II era are, in part, an artifact of data inhomogeneity during that era, as shown in the supporting information of our Young People’s Burden paper: Hansen J, Sato M, Kharecha P et al. Young people’s burden: requirement of negative CO2 emissions. Earth Syst Dyn 2017;8:577-616
[11] Hansen J, Russell G, Lacis A et al. Climate response times: dependence on climate sensitivity and ocean mixing. Science 1985;229:857-9
[12] J.E. Hansen, M. Sato, L. Simons et al., “Global warming in the pipeline,” Oxford Open Clim. Chan. 3 (1) (2023): doi.org/10.1093/oxfclm/kgad008
Donate to CSAS Columbia:
https://csas.givenow.columbia.edu/#
Donate to CSAS Incompany:
https://donorbox.org/support-climate-science-awareness-and-solutions
Here are more “ET’s” recorded from around the planet the last couple of days, their consequences, and some extreme temperature outlooks, as well as any extreme precipitation reports:
Here is More Climate News from Wednesday:
(As usual, this will be a fluid post in which more information gets added during the day as it crosses my radar, crediting all who have put it on-line. Items will be archived on this site for posterity. In most instances click on the pictures of each tweet to see each article. The most noteworthy items will be listed first.)