The main purpose of this ongoing blog will be to track planetary extreme, or record temperatures related to climate change. Any reports I see of ETs will be listed below the main topic of the day. I’ll refer to extreme or record temperatures as ETs (not extraterrestrials).😜
Main Topic: U.S. March 2026 Record Scoreboard and Climatological Review
Dear Diary. It’s time for our monthly climatological review. Here on this site, we usually present monthly summaries near the 8th of each month, and each is available by clicking the link below:
https://guyonclimate.com/category/record-scoreboard-climatological-reviews
I’m repeating this mantra every month:
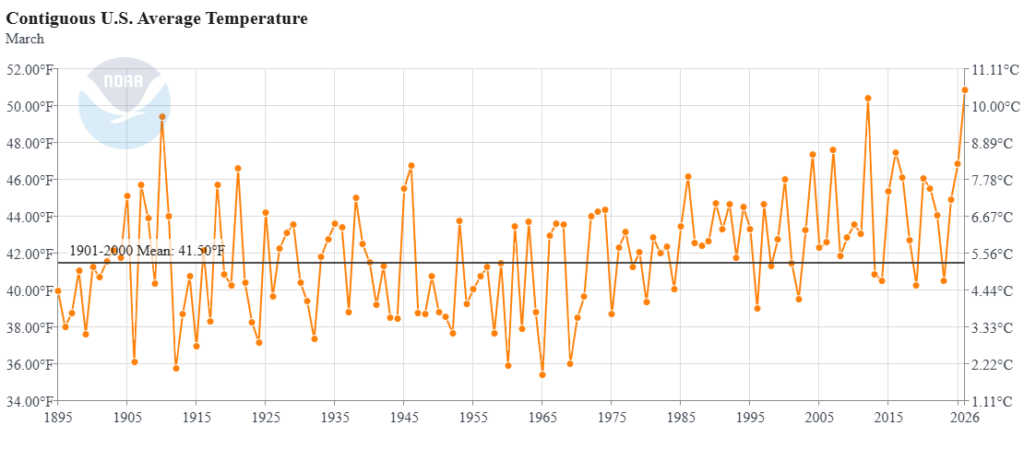
March 2026 was a whopper of a warm anomalous month due to climate change across the United States.
March 2026 got ranked by the National Center for Environmental Information for the lower 48 states as warmest or 132nd coolest since records began being kept in 1895 at +9.35°F above the 1901-2000 average.
The above data was from:
https://www.ncdc.noaa.gov/cag/national/rankings
During March the warmest conditions were in the southwest half of the nation. Not surprisingly, many western states had their record warmest March. During February most reports of record warmth came from the West and South during the entire month. Most reports of record chill came from Oregon, Washington, and Alaska. It was warm enough to produce this amazing statistic (next paragraph by Bob Henson):
Based on data available at NOAA’s U.S. Daily Records website through midday April 6, the month of March 2026 tied or broke a phenomenal 12,347 local daily record-warm maxima (e.g., the warmest high temp on any March 3 or March 25 at a given spot) and 10,197 local daily record-warm minima (e.g., the warmest low temp for that date). In addition, there were 2596 cases where the daily local maximum temperature broke or tied the all-time March record at that site, and 1263 where the daily local minimum did the same. According to meteorologist Guy Walton, who compiled and analyzes these reports, the March 2012 heat wave produced slightly more local daily heat records, but March 2026 produced more local monthly heat records (both maxima and minima) than any other month since recordkeeping began.
You can check out record totals for yourself on my NCEI record archives:
NCEI Record Count Archive – Guy On Climate
Here are my two U.S. Daily Record Scoreboards updated through 12/08/2025 (data compiled from the following NCEI site):
https://www.ncdc.noaa.gov/cdo-web/datatools/records
I’m also keeping tabs on record report totals to verify a scientific study I helped to complete in the decade of the 2000s. We’ll eventually see how skewed ratios of record warm to cold reports get by the year 2100, which the study mentions as 50-1 for DHMX vs. DLMN:
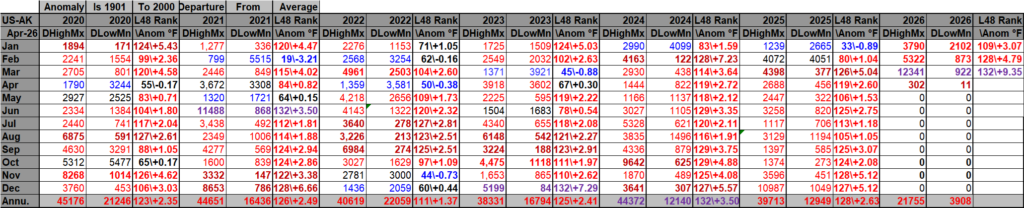
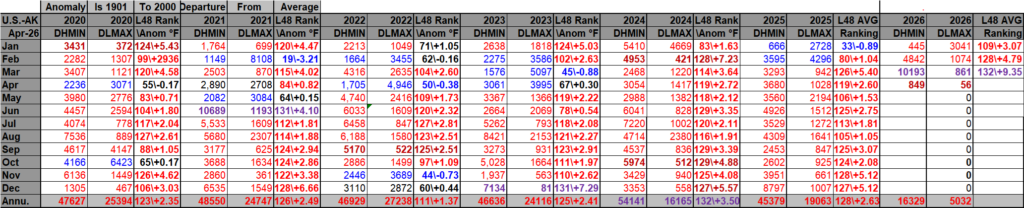
DHMX= Daily High Max Reports. DLMN= Daily Low Min Reports. DHMN= Daily High Min Reports. DLMX=Daily Low Max Reports.
Boldly highlighted red, blue, or purple colored months, such as December 2023 and June 2021, that have ratios of >10 to 1 daily or <1 to 10 of daily warm to low records are either historically hot or cold, most of which have made news. NCEI rankings are for the lower 48 states with the warmest ranking since 1895 of average temperatures being 132 and 1 being the coldest as of 2026. Blue colors represent cold months and red warm. Those months and years with counts close to a 1 to 1 ratio of highs to lows are colored black. All-time record hottest or coldest months and years are boldly colored in purple. NCDC rankings have been color coded (under tabs in each file) such that values of 55 to 75 are black representing neutral months or years (+ or – 10 from the average ranking of 64).
Totals are record reports for the entire United States including all territories minus those from Alaska. I’ve subtracted those from Alaska to get a better representation of what has occurred across the lower 48 states in association with lower 48 state rankings.
March 2026 had approximately a 13 to 1 ratio of record DHMX to DLMN individual record counts and was record warmest, so the color I used for that month was purple on the top chart.
March 2026 had approximately a 11 to 1 ratio of record DHMN to DLMX individual record counts, so the color I used for that month was red on the bottom chart.
Due to climate change, we are seeing fewer blue colors on these Record Scoreboards with time.
The average temperature lower 48 state ranking for March 2026 was 132 (warmest on record), which was colored purple. We are seeing fewer blue colors on my charts, and March 2026 was yet another warm month.
I color rankings of +10 to -10 from the average ranking for the lower 48 states of 65 black, indicating that these are near average temperature wise. The top warmest ranking for 2026 would be 132 since rankings began in 1895.
April 2026 has gotten off to a very warm start for most of the nation. The West will be cooling off finally while the eastern 2/3rds of the country will see record warmth from time to time. Overall, we are looking at another top twenty warmest Aprils looking at met models.
Interestingly, here is what we see as far as overall yearly ratios go for the 2020s so far. Warmth is key here:
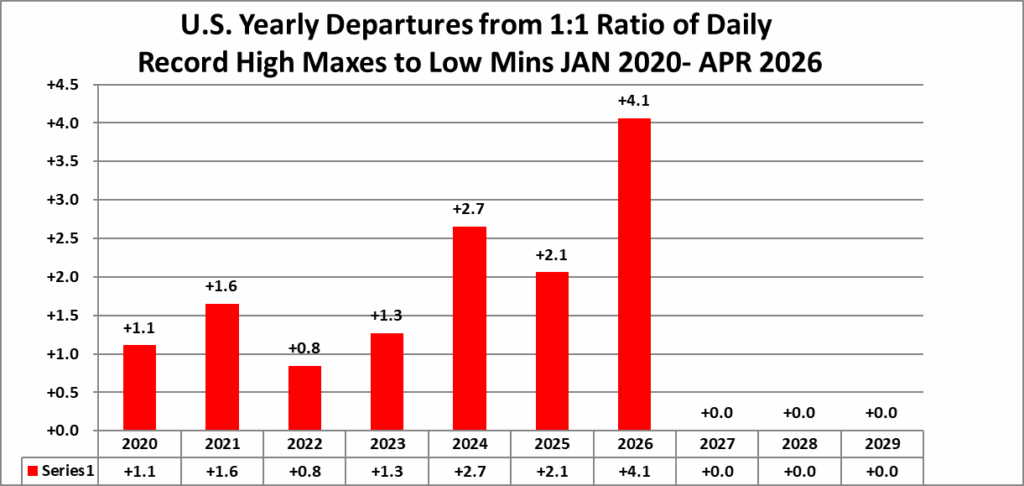
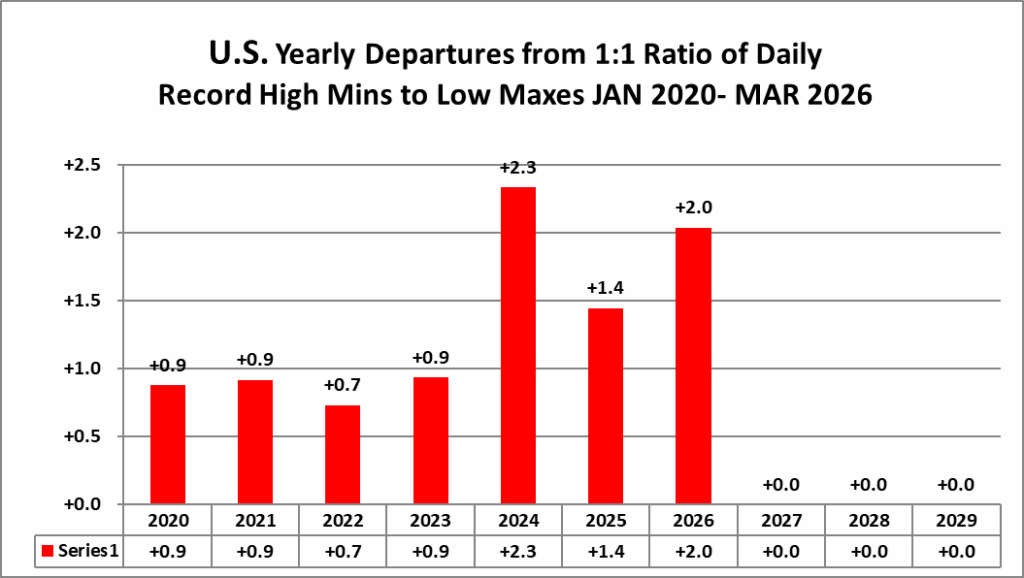
We now have 6 out of 10 full years’ worth of data for the 2020s. Interestingly, 2026 now stands out as the warmest year after March 2026 data got processed.
Here is much more detailed climatology for March 2026 as complied by NOAA:
Assessing the U.S. Temperature and Precipitation Analysis in March 2026
Warmest March on Record for the Contiguous U.S.

Published
April 8, 2026
Related Links
March 2026 U.S. Climate Report (Available April 13, 2026)
National Temperature and Precipitation Maps
Climatological Rankings Explained
State of the Climate Summaries
March 2026 County Superlatives
Key Takeaways:
- Warmest March: The contiguous U.S. (CONUS) average temperature was 9.4°F above the 20th-century average, making March 2026 the warmest March in the 132-year record.
- Prolonged warmth: The April 2025–March 2026 period now stands as the warmest 12-month span ever recorded for the CONUS (since 1895).
- Record daily heat: 1,432 counties—over half the CONUS area and one-third of the population—observed their single warmest March day on record (1950–present).
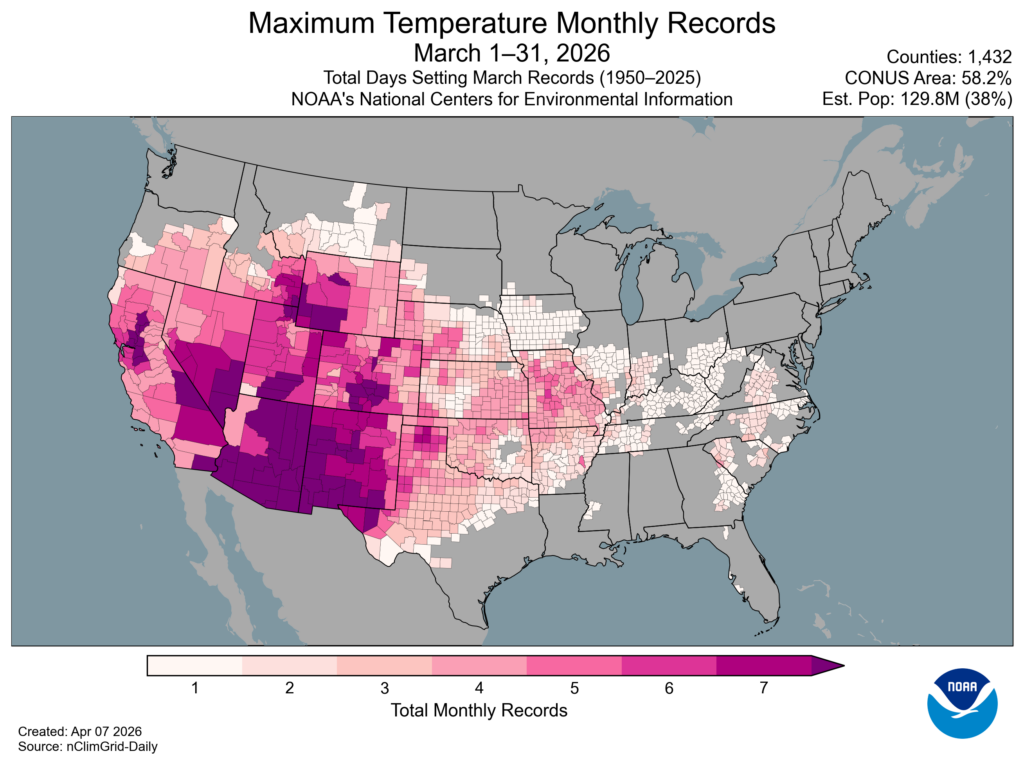
Map of the U.S. Maximum Temperature Monthly Records in March 2026.
- Record-dry year to date: The January–March period was the driest on record for the CONUS—less than 70% of average—breaking the previous record set in 1910.
- Notable drought footprint: Dry conditions expanded drought to nearly 60 percent of the CONUS—the largest extent of drought since November 2022.
- Cold in Alaska: Alaska had its fourth-coldest March on record (since 1925) and the coldest since 2007.
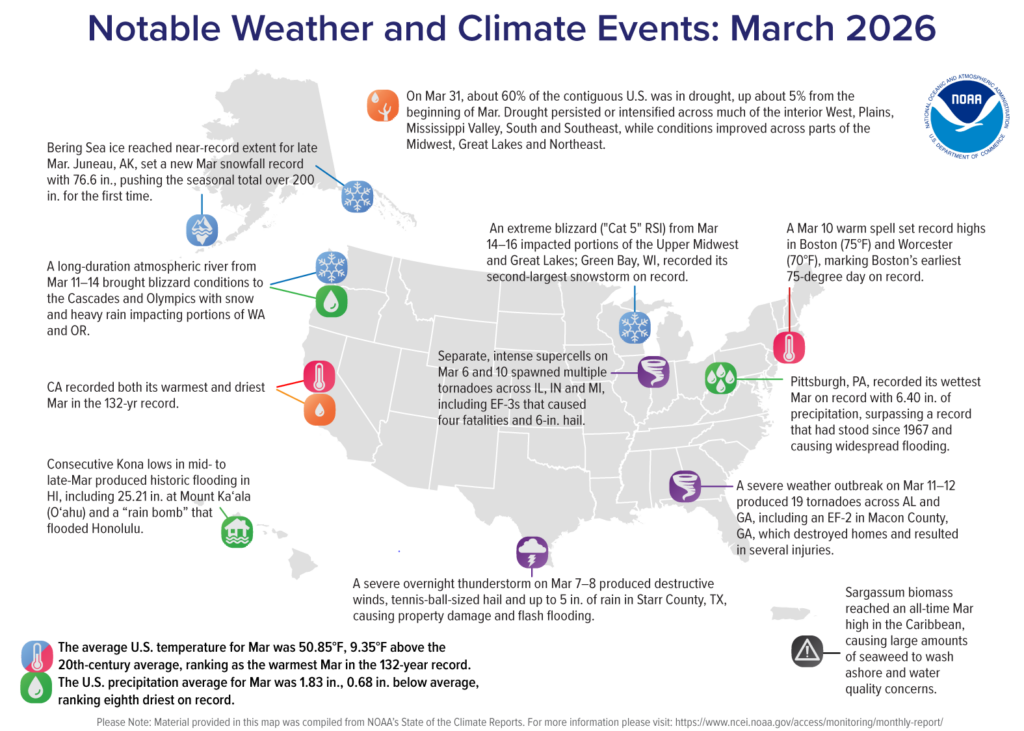
Map of the U.S. notable weather and climate events in March 2026.
Other Highlights:
Temperature
The CONUS average temperature in March was 50.85°F, 9.35°F above the 20th-century average, marking the first time any month’s average has exceeded 9°F above that baseline. Maximum daytime temperatures were especially high, averaging 11.4°F above the March average and 0.9°F above the April long-term average.
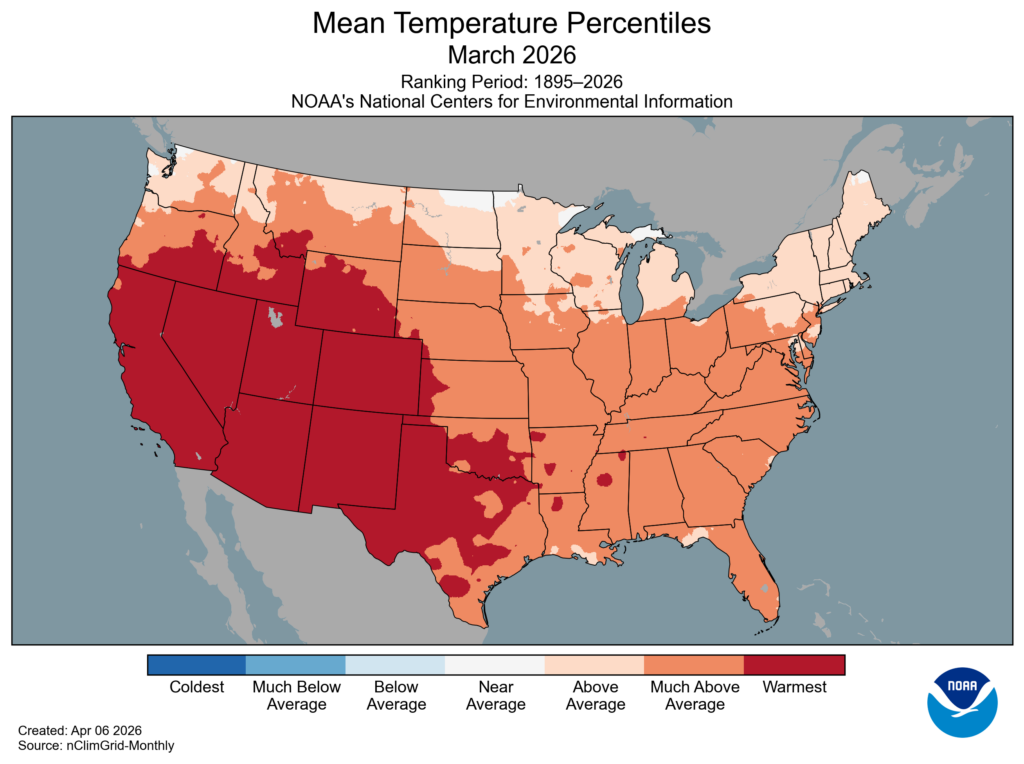
March 2026 U.S. Mean Temperature Percentiles Map.
Much of the country south of the far northern tier, from the Pacific to the Atlantic, experienced much-above-average temperatures. A broad region spanning the central Pacific Coast, Great Basin, Southwest, and parts of the Rockies and southern Plains observed record warmth, highlighting the widespread extent of the month’s exceptional temperatures.
Ten states recorded their warmest March on record: Arizona, California, Colorado, Idaho, Nevada, New Mexico, Oklahoma, Texas, Utah and Wyoming. Across all of these states, average temperatures exceeded their respective April averages, with California also eclipsing its average May temperature by 0.7°F.
At the county level, more than 500 counties—covering over one-quarter of the CONUS and affecting an estimated 79 million people—recorded their warmest March on record, reflecting the broad geographic footprint of the month’s record warmth.
Hawai‘i’s statewide average temperature was 65.0°F, 1.5°F above the 1991–2020 average, ranking as the fifth-warmest March in the 36-year record. Daytime temperatures were near average, but statewide average minimum temperatures stood out at 59.2°F—the warmest March nighttime temperatures on record (1991–present), more than 1°F above the previous record set in 2006.
In contrast, Alaska’s statewide average temperature was 0.6°F, 10.2°F below the 1925–2000 average. While the North Slope remained near average, much of the state experienced much-below-average temperatures, with parts of the southeast interior, southern coast and panhandle recording record-cold conditions. Minimum temperatures were especially notable, ranking as the third-coldest March on record and the coldest since 1972.
Precipitation
The average precipitation total for the CONUS in March was 1.83 inches, 0.68 inch below the 20th-century average, ranking as the eighth-driest March in the 132-year record. Combined with January and February deficits, this period marks the driest first three months of any year on record for the CONUS.
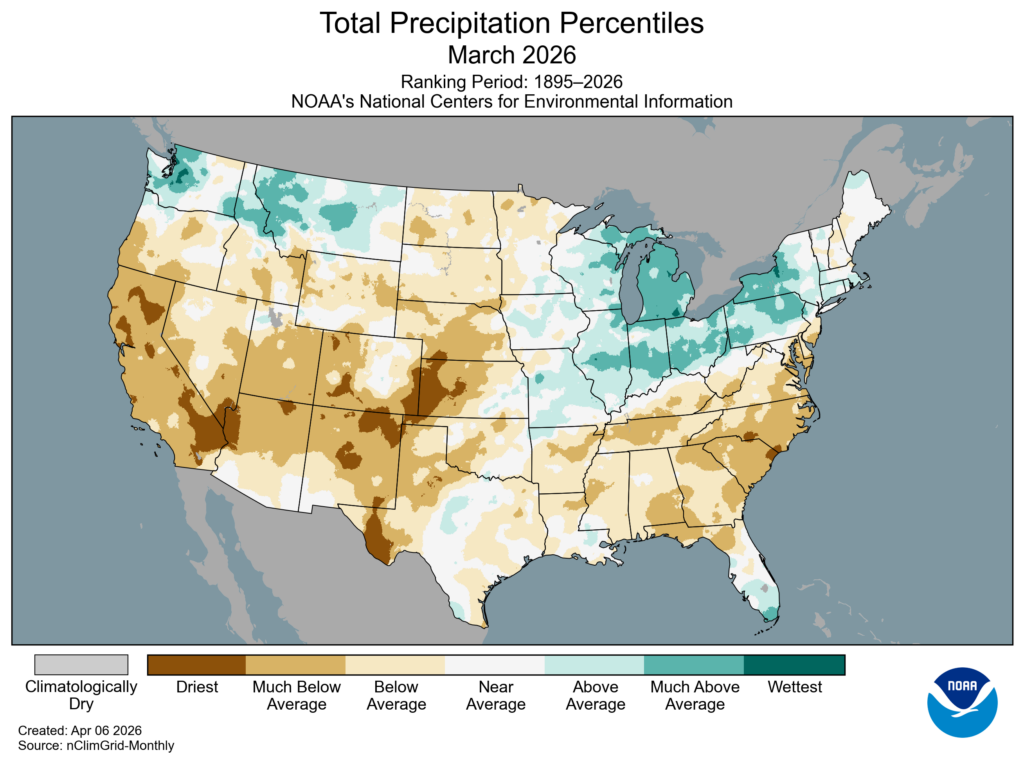
March 2026 U.S. Total Precipitation Percentiles.
March precipitation was much below average across much of the West, Southwest, portions of the Plains, Deep South and Southeast. In contrast, above-average precipitation totals fell across parts of the Northwest and northern Rockies, as well as across the Upper Midwest and Great Lakes region.
In total, nine states across the Lower-48 ranked among their 10-driest Marches. California received less than a quarter-inch of precipitation statewide—less than 10% of its 20th-century March average and the lowest March total in the 132-year record. Colorado and New Mexico each tied their second-driest March on record, while North and South Carolina each experienced one of their five-driest Marches. In contrast, Michigan received nearly twice its average March precipitation—its third-highest March total on record.
Simultaneously hot and dry conditions affected 12 states, where much-above-average temperatures occurred alongside much-below-average precipitation, with potential impacts on snowpack and water resources in the coming months. California exemplified these extremes, recording both its warmest and driest March on record.
Precipitation across Hawaii was much above average for the month, with many areas—including large portions of the Big Island, Maui, Moloka‘i and O‘ahu—experiencing their wettest March on record (since 1991). This exceptional wetness was driven by back-to-back Kona low systems mid-month that triggered widespread major flooding and landslides across the island chain.
Alaska’s statewide precipitation was much lower than average, especially over portions of the Southwest, the Alaska Peninsula and Aleutians. However, the cold air over mainland Alaska brought above-average snowfall to much of Southeast Alaska, with several locations recording their highest March totals in more than a decade.
Drought
According to the March 31 U.S. Drought Monitor report, about 59.9% of the CONUS was in drought, an increase of about 5.0% from the beginning of the month. Drought conditions persisted or intensified across much of the interior West, the Plains, Mississippi Valley, South and Southeast, with notable degradation across the Rockies and central Plains. In contrast, drought contracted or eased across portions of the Midwest, Great Lakes and Northeast.
Monthly Outlook
Above-average temperatures are favored across much of the CONUS for April, with the highest probabilities centered over the Great Basin, Four Corners region and parts of the Southeast. Above-average precipitation is favored for a corridor stretching from the southern Plains through the Mississippi Valley and Great Lakes into the Northeast, while drier-than-average conditions are forecast for the West and parts of the central Rockies and Southeast. Above-average temperatures and precipitation are indicated for northern and western parts of Alaska. Visit the Climate Prediction Center’s Official 30-Day Forecasts for more details.
Drought is expected to persist and expand across much of the interior West, Southwest, Rockies and High Plains, as well as parts of the South, Southeast and Mid-Atlantic. However, some improvement or drought removal is forecast for parts of the southern Plains, Mississippi Valley and Northeast. Visit the U.S. Monthly Drought Outlook website for more details.
Significant wildland fire potential is above normal across portions of the Southwest, southern Plains and central High Plains and much of the Deep South and Southeast. For additional information on wildland fire potential, visit the National Interagency Fire Center’s One-Month Wildland Fire Outlook
For more detailed climate information, check out our comprehensive March 2026 U.S. Climate Report scheduled for release on April 13, 2026. For additional information on the statistics provided here, visit the Climate at a Glance and National Maps webpages.
Here are some “ETs” recorded from around the U.S. the last couple of days, their consequences, and some extreme temperature outlooks, as well as any extreme precipitation reports:
Here is More Climate News from Wednesday:
(As usual, this will be a fluid post in which more information gets added during the day as it crosses my radar, crediting all who have put it on-line. Items will be archived on this site for posterity. In most instances click on the pictures of each tweet to see each article. The most noteworthy items will be listed first.)