The main purpose of this ongoing blog will be to track planetary extreme, or record temperatures related to climate change. Any reports I see of ETs will be listed below the main topic of the day. I’ll refer to extreme or record temperatures as ETs (not extraterrestrials).😜
Main Topic: U.S. July 2026 Record Scoreboard and Climatological Review
Dear Diary. It’s time for our monthly climatological review. Here on this site, we usually present monthly summaries near the 8th of each month, and each is available by clicking the link below:
https://guyonclimate.com/category/record-scoreboard-climatological-reviews
I’m repeating this mantra every month:
July 2026 got ranked by the National Center for Environmental Information for the lower 48 states as the hottest July on record or 132st coolest since records began being kept in 1895 at +3.30°F above the 1901-2000 average. It also marked the hottest month on record period.
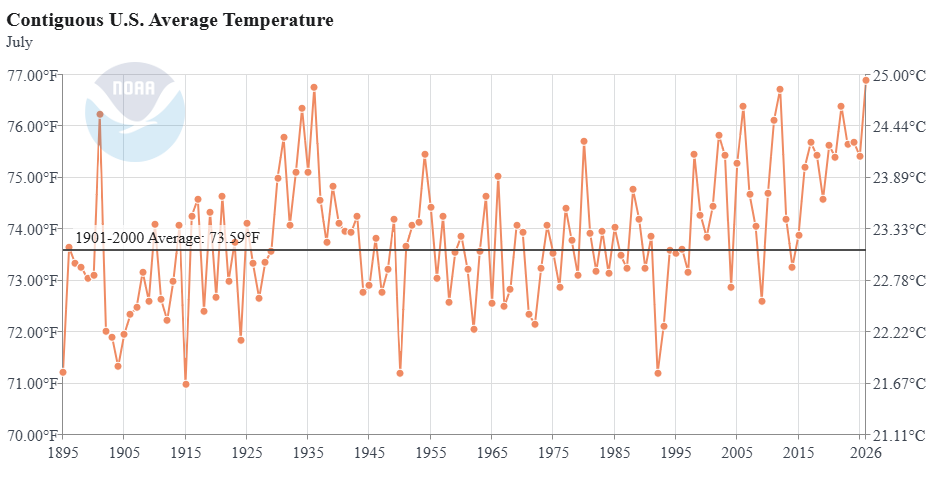
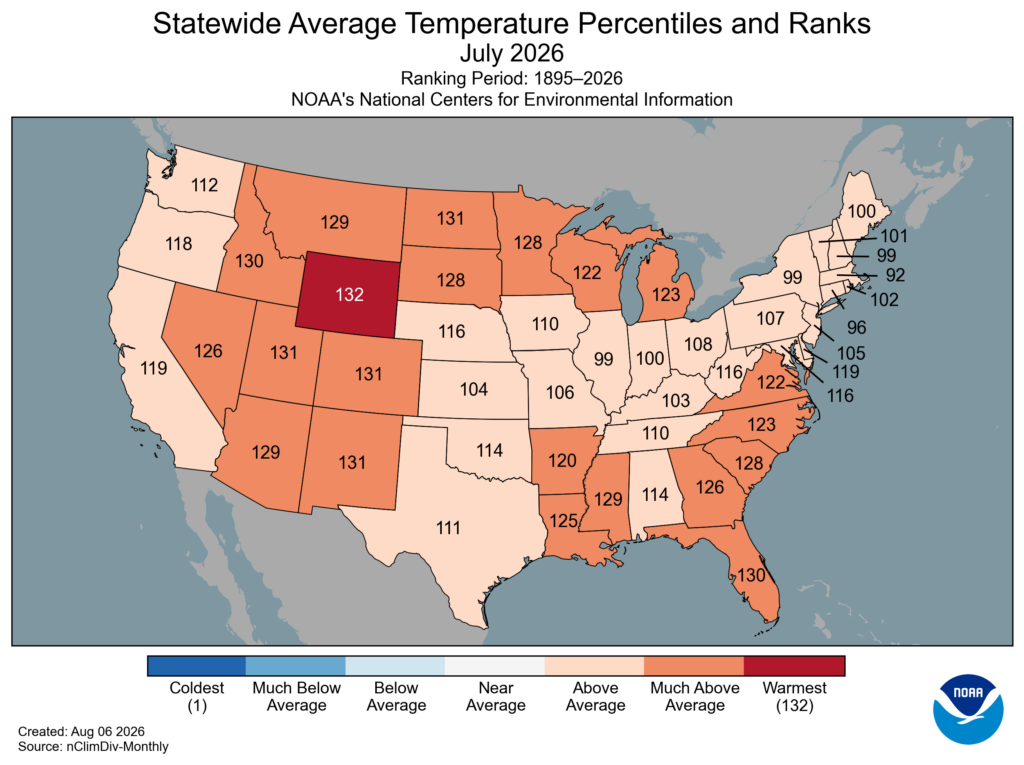
The above data was from:
https://www.ncdc.noaa.gov/cag/national/rankings
Brief summary for July 2026: Most reports of record heat came from the Midwest and Northeast in association with a heatwave from the first week of the month and in the West from a heatwave occurring during the 4th week of the month. What few reports of record chill came mainly from Alaska and the Pacific Northwest during the first half of the month and Midwest the last week of July.
It was hot enough to log 387 reports of all-time record heat.
You can check out record totals for yourself on my NCEI record archives:
NCEI Record Count Archive – Guy On Climate
Here are my two U.S. Daily Record Scoreboards updated through 8/10/2026 (data compiled from the following NCEI site):
https://www.ncdc.noaa.gov/cdo-web/datatools/records
I’m also keeping tabs on record report totals to verify a scientific study I helped to complete in the decade of the 2000s. We’ll eventually see how skewed ratios of record warm to cold reports get by the year 2100, which the study mentions as 50-1 for DHMX vs. DLMN:
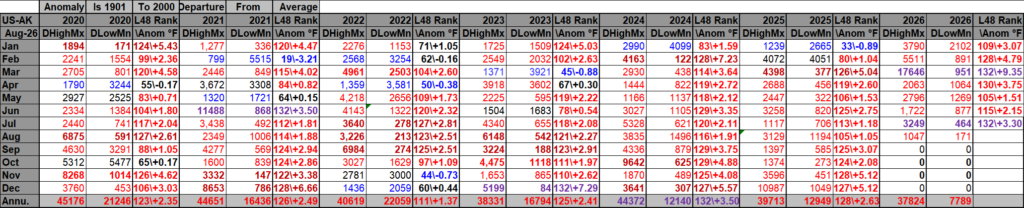
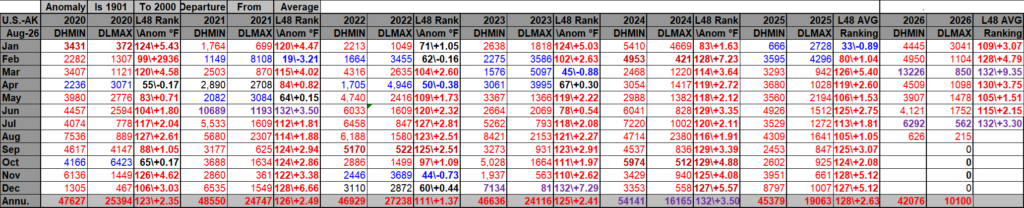
DHMX= Daily High Max Reports. DLMN= Daily Low Min Reports. DHMN= Daily High Min Reports. DLMX=Daily Low Max Reports.
Boldly highlighted red, blue, or purple colored months, such as December 2023 and June 2021, that have ratios of >10 to 1 daily or <1 to 10 of daily warm to low records are either historically hot or cold, most of which have made news. NCEI rankings are for the lower 48 states with the warmest ranking since 1895 of average temperatures being 132 and 1 being the coldest as of 2026. Blue colors represent cold months and red warm. Those months and years with counts close to a 1 to 1 ratio of highs to lows are colored black. All-time record hottest or coldest months and years are boldly colored in purple. NCDC rankings have been color coded (under tabs in each file) such that values of 55 to 75 are black representing neutral months or years (+ or – 10 from the average ranking of 64).
Totals are record reports for the entire United States including all territories minus those from Alaska. I’ve subtracted those from Alaska to get a better representation of what has occurred across the lower 48 states in association with lower 48 state rankings.
July 2026 had approximately an 8 to 1 ratio of record DHMX to DLMN individual record counts, but the color I used for that month was purple on the top chart because the month was the warmest July in recorded history.
July 2026 had approximately an 11 to 0 ratio of record DHMN to DLMX individual record counts, so the color I used for that month was red on the bottom chart because the month was the warmest July in recorded history
Due to climate change, we are seeing fewer blue colors on these Record Scoreboards with time.
The average temperature lower 48 state ranking for July 2026 was 132 (warmest on record), which was colored purple since it was the warmest on record. We are seeing fewer blue colors on my charts, and July 2026 was yet another anomalously hot month.
I color rankings of +10 to -10 from the average ranking for the lower 48 states of 65 black, indicating that these are near average temperature wise. The top warmest ranking for 2026 would be 132 since rankings began in 1895.
August 2026 has gotten off to a hot start for most of the nation. A historically hot heatwave will develop across the southern states this weekend into next week, which should make the month anomalously hot for lower 48 state averages. Overall, August should be above average and could make the top ten warmest list looking at current model guidance.
Interestingly, here is what we see as far as overall yearly ratios go for the 2020s so far. Warmth is key here:
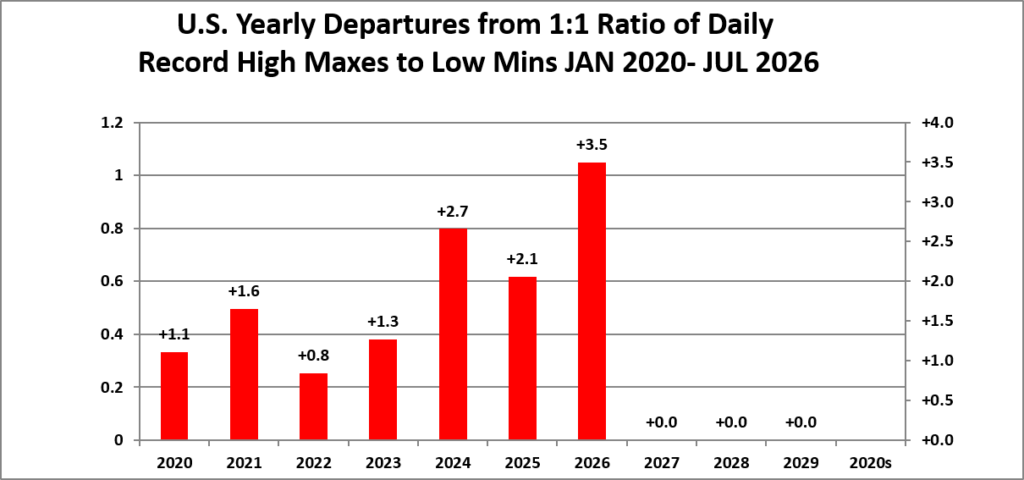
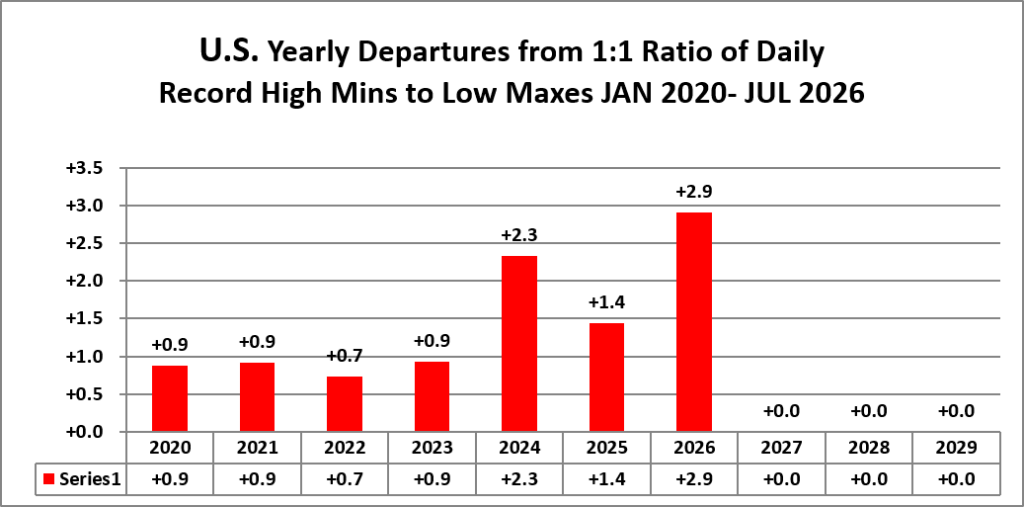
We now have 6 out of 10 full years’ worth of data for the 2020s. Interestingly, 2024 stands out as the second warmest year, which was also the year with a strong El Niño. We are now seeing the warmest year, so far during 2026, which will get pegged as another year with a strong El Niño.
Here is much more detailed climatology for July 2026 as complied by NOAA:
Assessing the U.S. Temperature and Precipitation in July 2026
July marks the warmest month on record for the contiguous U.S.

Courtesy of Canva.com
Key Takeaways:
Warmest on record: July 2026 averaged 76.9°F, the warmest month on record (1895–present) for the contiguous United States (CONUS).
Widespread warmth: Above-average temperatures covered the entire CONUS, with all states ranking in the warmest third of their July temperature records and none ranking near or below average.
Dry with regional flooding events: Despite below-average July precipitation for the CONUS as a whole, several regions experienced heavy rainfall, including major flash flooding events in the Texas Hill Country and eastern New York.
Alaska cool: Alaska had the coldest July average temperature since 2008.

Other Highlights:
Temperature
The average temperature for the CONUS in July was 76.9°F, 3.3°F above the 20th-century average. This was the warmest July—and warmest month—in the 132-year record, 0.1–0.2°F warmer than July 1936 and July 2012.

Daytime maximum temperatures averaged 89.5°F, 2.9°F above average, ranking as the sixth-warmest month on record for average high temperatures, while overnight minimum temperatures averaged 64.2°F, 3.7°F above average, ranking as the warmest month on record for average low temperatures, surpassing July 2022 by 0.7°F.
Above-average temperatures extended across the entire CONUS in July, with much-above-average temperatures observed throughout much of the interior West, Southwest, Rockies, northern Plains and Upper Midwest, as well as parts of the Gulf Coast and Southeast. All CONUS states were at least 1°F above their 20th-century average, with 13 states ranking among their five warmest Julys. Wyoming recorded its warmest July and warmest month on record, with temperatures 5.1°F above average and 0.9°F warmer than its previous July record set in 2007.
Alaska’s average temperature was 51.8°F, 0.9°F below the 1925–2000 average, ranking in the coolest third of the 102-year record. Below-average temperatures were observed across portions of the interior, as well as parts of the Alaska Peninsula and Panhandle.
Hawai’s average temperature was 69.4°F, 0.6°F above the 1991–2020 average, ranking in the middle third of the 36-year record. While overnight minimum temperatures were above- to much-above average across the island chain, daytime temperatures were near or below average for the month.
Precipitation
Total precipitation averaged across the CONUS in July was 2.55 inches, 0.23 inch below the 20th-century average, ranking in the driest third of the 132-year record.

Precipitation across the CONUS during July reflected a mix of wet and dry conditions. Below-average precipitation occurred across portions of the northern tier, including parts of the northern Rockies, northern Plains, Upper Midwest and Northeast, as well as parts of the southern Plains, Mississippi Valley, Central Gulf and Southeast. In contrast, pockets of above-average precipitation were observed across parts of the West and Southwest, central Plains and Upper Midwest, as well as portions of Texas, the Tennessee and lower Ohio Valleys, Mid-Atlantic and lower Northeast.
Alaska’s average precipitation was 4.30 inches in July, 1.02 inches above the 1925–2000 average, ranking in the wettest third of the 102-year record. Southern and southwestern portions of the state, including the Alaska Peninsula, received above-average to much-above-average precipitation, with Anchorage tying its highest July precipitation total on record. In contrast, portions of the Alaska Panhandle received below-average precipitation.
Hawaiʻi averaged 5.20 inches of precipitation in July, 0.56 inch above the 1991–2020 average, ranking in the wettest third of the 36-year record, despite localized regions that saw below-average totals. The year-to-date statewide precipitation total remained the wettest on record, with a January–July total of nearly five feet (59.82 inches), 25.43 inches above average (173.9% of normal).
Drought
According to the August 4 U.S. Drought Monitor, about 48.5% of the CONUS was in drought, an increase of about 0.7 percentage points since the end of June. Drought persisted over much of the interior West, Southwest and Rockies, and expanded or intensified across parts of the Northwest, southern and northern Plains, Upper Midwest and far Northeast. In contrast, drought contracted or decreased in intensity across portions of the Lower Mississippi Valley, Tennessee Valley and much of the Southeast and Mid-Atlantic region. In Puerto Rico, more than two-thirds of the island was in drought, with more than one-third classified as severe drought or worse.
Monthly Outlook
Above-average August temperatures are favored across the central and southern tiers of the CONUS, with portions of coastal California and the southern Plains having a greater than 50 percent likelihood of above-average temperatures. Precipitation has equal chances of being above or below average across much of the CONUS, except in parts of the interior West and Southwest where above-average rainfall is favored and in portions of the southern Plains and Lower Mississippi Valley where below-average precipitation is favored. Visit the Climate Prediction Center’s Official 30-Day Forecasts for more details.
Drought is expected to persist and expand across parts of the Northwest and east of the Rockies, including portions of the Plains and Upper Midwest, as well as in Puerto Rico and the U.S. Virgin Islands. Drought conditions are expected to improve across parts of the interior West and Southwest, and along much of the eastern seaboard. Visit the U.S. Monthly Drought Outlook website for more details.
Significant wildland fire potential for August is above normal across the Northwest, Great Basin and central Rockies, parts of the northern and southern Plains, the Lower Mississippi Valley, southern Florida and Puerto Rico. For additional information on wildland fire potential, visit the National Interagency Fire Center’s One-Month Wildland Fire Outlook.
For more detailed climate information, check out our comprehensive July 2026 U.S. Climate Report scheduled for release on August 13, 2026. For additional information on the statistics provided here, visit the Climate at a Glance and National Maps webpages.
Published
August 10, 2026
More:
Here are some “ETs” recorded from around the U.S. the last couple of days, their consequences, and some extreme temperature outlooks, as well as any extreme precipitation reports:
Here is More Climate News from Monday:
(As usual, this will be a fluid post in which more information gets added during the day as it crosses my radar, crediting all who have put it on-line. Items will be archived on this site for posterity. In most instances click on the pictures of each tweet to see each article. The most noteworthy items will be listed first.)