Friday August 16th… Dear Diary. The main purpose of this ongoing blog will be to track United States extreme or record temperatures related to climate change. Any reports I see of ETs will be listed below the main topic of the day. I’ll refer to extreme or record temperatures as ETs (not extraterrestrials).😉
New Local Record Count Statistics From Climate Central
There was a whirlwind of new climate news yesterday vying for being the top story for the day, the worst being that the planet just experienced its hottest month in recorded history, so I put off part two of Climate Central’s report until today. I’m pleased that Climate Central has announced that they have once again taken up the mantle of what I started during the 2000’s with record statistics, publishing the following article:
Local: records by decade
- Published: August 15th, 2019

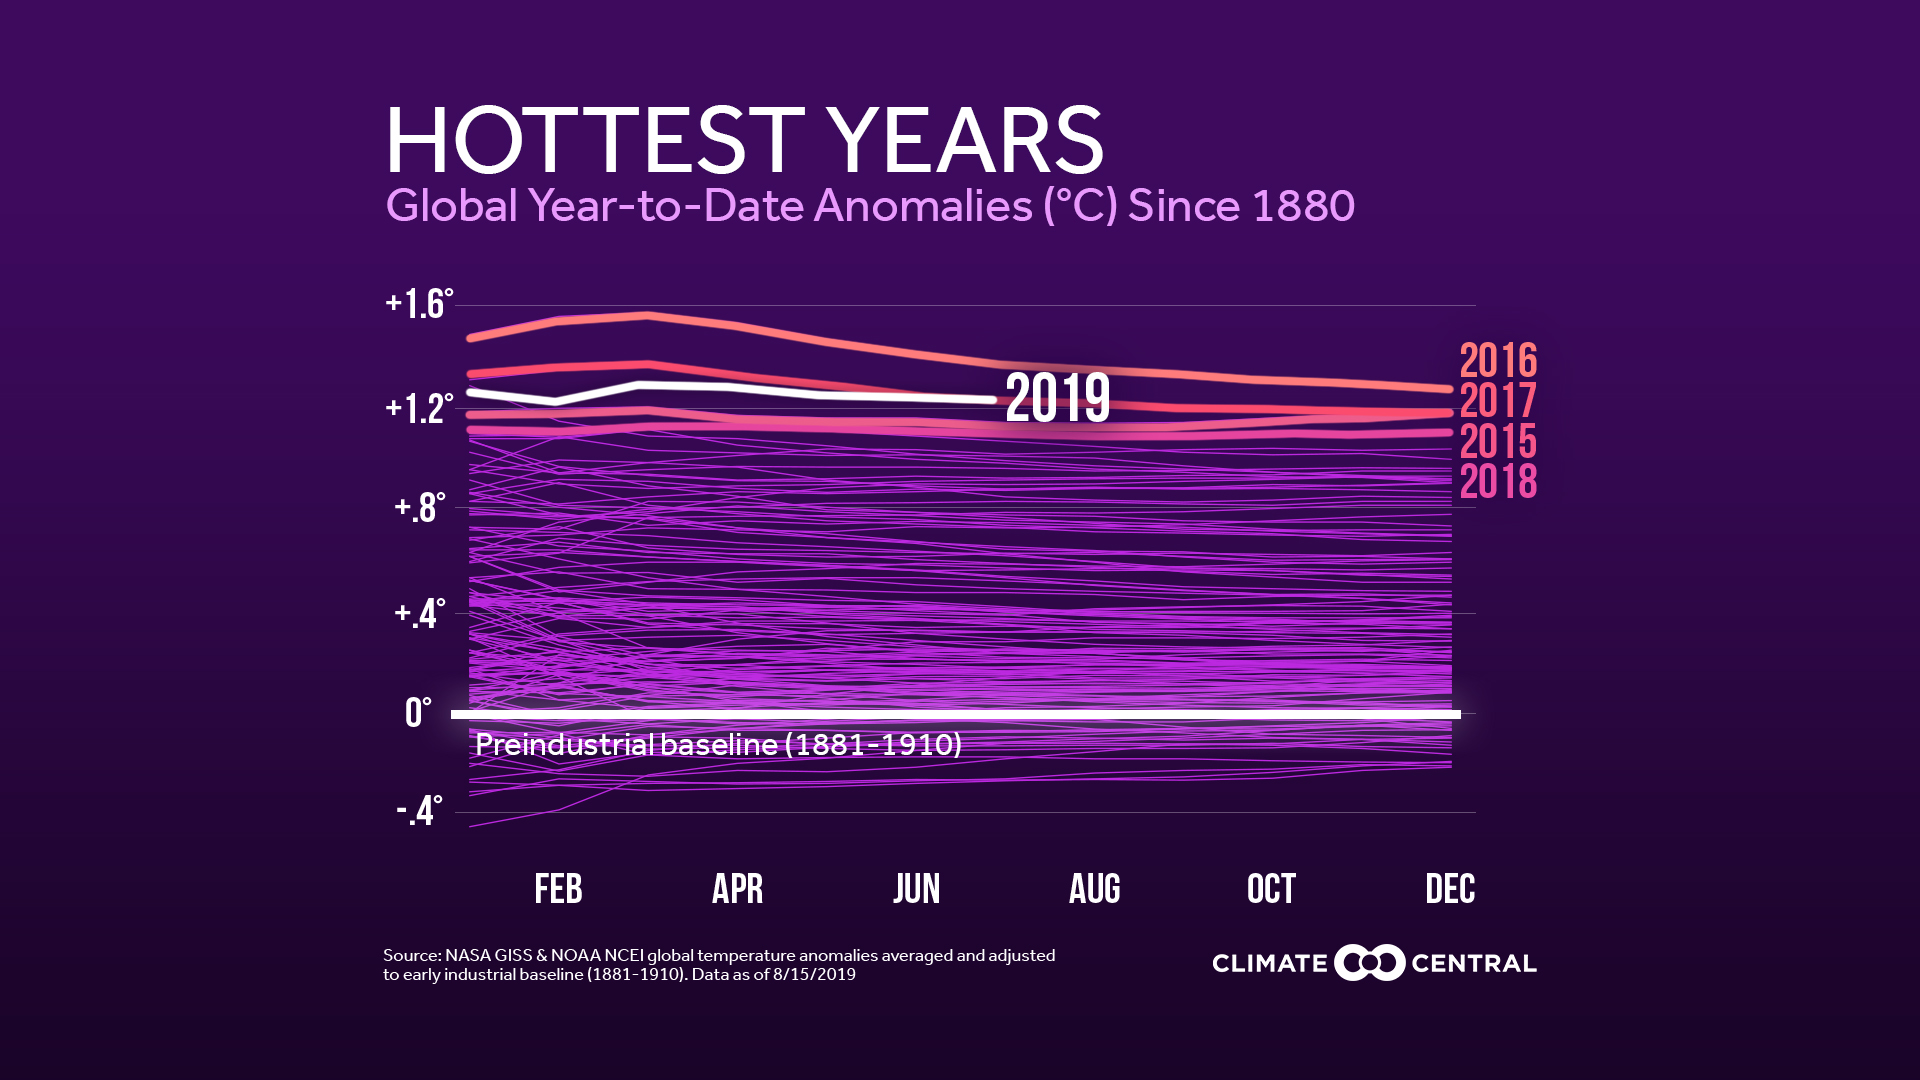
Today, NOAA named this past July the hottest month on record, confirming statements from the World Meteorological Association and Europe’s Copernicus Climate Change Service. While this event is historic, it is by no means an exception. The past five years have been the warmest on record globally, leading to unprecedented heat that is projected to intensify as the climate warms.
Local: records by decade
To show how this warming has affected your area, Climate Central has paired global graphics with a new look into local temperature records. The local analysis compiles daily temperature records for a station’s entire period, and shows the percentage of records in each decade that were hot or cold. Most local observations follow the global trend, with record highs outnumbering lows in recent years. Here are some highlights:
- The 2010s have the greatest imbalance of record highs in 133 of the 244 cities analyzed (55%).
- That’s nearly four times higher than the next-closest decade (2000s).
- For six southwestern cities, all of this decade’s daily records are highs—as those cities haven’t had a record low since before 2010.
- While the 1930s do hold notable heat records, only 34 of the cities analyzed (14%) still have this as their decade with the highest percent of record highs.
- Dust Bowl-era heat is being overtaken by more recent human-caused warming from greenhouse gases. The urban heat island effect also contributes—especially to warming nights.

Globally, the recent warming has been sharpest in the Arctic—and this July was no exception. Temperatures in Alaska shattered records by several degrees, and hundreds of wildfires burned in Alaska, Siberia and Greenland. Arctic sea ice extent also set a new record low for July, and Greenland lost 12.5 billion tons of ice in just one day. The polar warmth followed an unprecedented heat wave across Western Europe, which would have been “extremely unlikely without climate change” (according to World Weather Attribution).
Extreme heat is the deadliest form of weather in the U.S., but it’s far from the only issue. Warming temperatures also increase the frequency and intensity of other extreme weather—harming health, stressing food and water supplies, shifting seasons and ecosystems, elevating sea levels, damaging infrastructure and economies, and threatening ways of life. Curbing these hazards may be the greatest challenge of our time, but mitigating solutions exist from renewable energy to more efficient transportation and agriculture.
METHODOLOGY:
Local records:
Series of daily records were identified each year since the start of the period of record, then aggregated by decade. To be clear, this not only represents the location’s current record for each calendar day, but a count of the records as they happened since that station thread was established. This series is based on Threadex data, when available, so it represents each of the local historic records as accounted by NOAA/NCEI; records over time may exist for different siting locations, corresponding with the NOAA supported records.
Global data:
Monthly global temperature analyses are independently calculated by NASA and NOAA/NCEI. Climate Central combines the NOAA and NASA information to re-baseline global temperatures using an earlier pre-industrial period of 1881-1910 in response to the internationally agreed upon goal of 2oC established in the Paris Climate Change Agreement.
Posted in Trends, Climate, Extremes, Heat, Climate Statistics
Please click on the widget in the report to see how your large town or city is warming. Statistically, all this is another different way, besides just calculating departure from average, to show how much areas of the world have warmed. Again, it is my hope, and today my birthday wish, that those in power will heed warning signs from yet another report.
Here is more climate and weather news from Wednesday:
(As usual, this will be a fluid post in which more information gets added during the day as it crosses my radar, crediting all who have put it on-line. Items will be archived on this site for posterity. In most instances click on the pictures of each tweet to see each article.)
And here are some “ETs” that we will be watching for next week:
(If you like these posts and my work please contribute via the PayPal widget, which has recently been added to this site. Thanks in advance for any support.)
Guy Walton- “The Climate Guy”