After cataloging counts of daily records in the National Center for Environmental Information’s database for Canada, I began looking to see what country should be next on my list to research. For reference, here is what I came up with for Canada: https://guyonclimate.com/2017/04/28/canadian-record-trends/
Not every country, such as Brazil, has records in the database, so I needed to do some searching. Walla, the database had about as many tallies as Canada for Russia, which was another large country to boot. Oh the irony with what I found given that Russia is very much in the news these days.
Members of the current U.S. administration have wanted to do big business with Russia in the past, and were aghast that sanctions were put in place over the last few years against the oligarchs that rule there. There are charges of collusion with Putin’s government, and Washington D.C. is currently in a tizzy over that scandal. Make no bones about it, Russia’s economy is propped up by the export of oil. Exxon wants to get a piece of that lucrative industry that could be worth a half trillion dollars with a capital T over the next decade. Slick, yes oil slick, corruption can be rampant given the price of what is at stake. You can follow the money here from this prior post where I connected the greedy dots:
https://guyonclimate.com/2017/03/15/burn-baby-burn/
Well back to pure science. It’s time for another sort of Russian investigation that would make James Bond happy.😊 Looking at daily record trends, of the U.S., Canada, or Russia, which country is warming faster? Why it’s that good old petro Putin’s Russia:
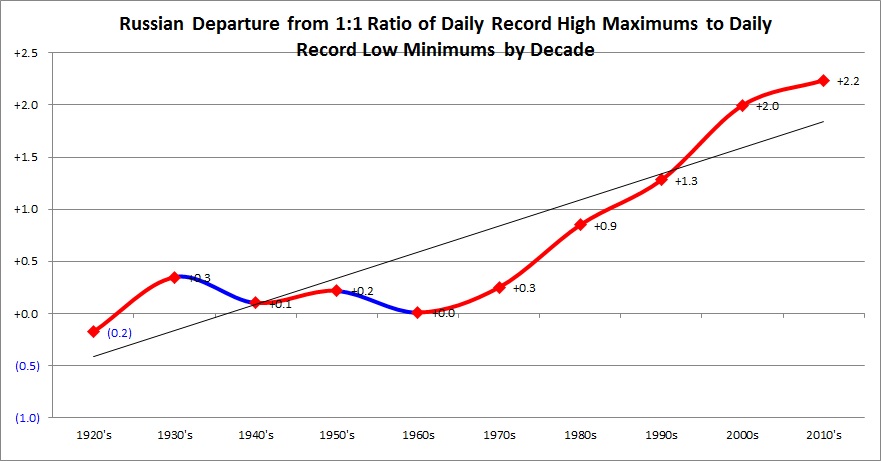
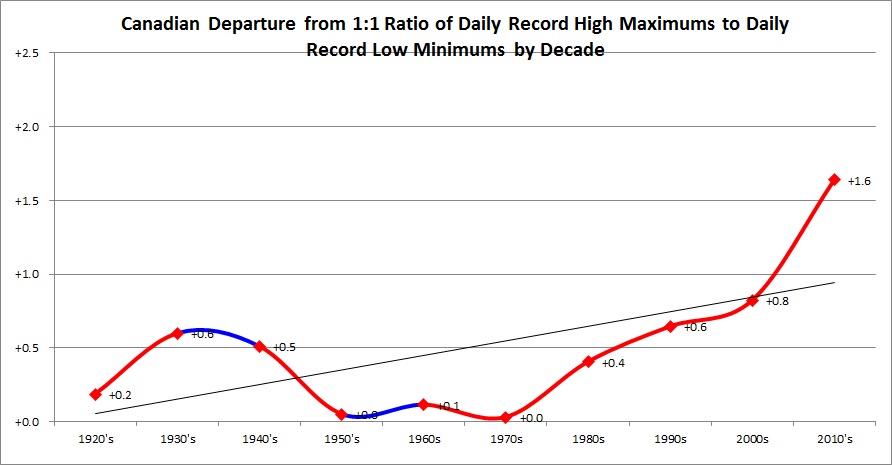

Each chart is similar looking, but one can see that the ratio of daily high maxes to daily low minimums for this decade is well over 3 to 1 in Russia as opposed to slightly over 2 to 1 in the U.S. The 1930’s “bump of warmth” appears on each chart. The ramifications of the bump for climate science maybe important… will keep all posted if I learn more.
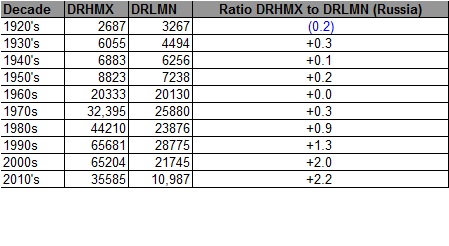
For reference here are the thousands of reports per decade encompassing each chart:

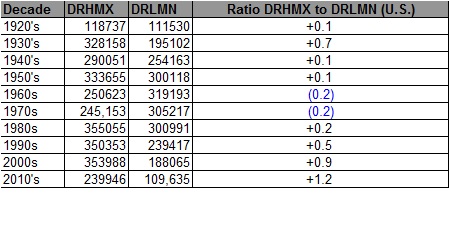
Note that relative to the United States and Canada the number of record counts tail off prior to 1960, so statistical trends before that date in Russia may not be so reliable.
What about an initial colored “Records Genome” for Russia? Again, just like with Canada, I have not found a data site containing monthly average rankings for Russia… will add these if they are available.
This chart is astoundingly similar to that of the U.S. The 29 month streak of more DRHMX than DRLMN in the U.S. began on the same month as a similar Russian streak, December 2014. Russia did have a cold fall/early winter last year ending their longest streak at 22 months. The U.S. keeps beating the poor Russians.😊

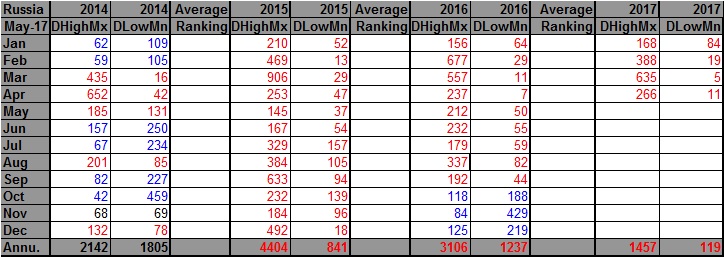
It’s most alarming to me to find that Russia’s month with the highest ratio of DRHMX to DRLMN was March 2017. In the U.S. we recently saw the two highest ratios in November 2016 and February 2017. Obviously, all of this is very recent history.
Why is this important? Because methane, another greenhouse gas, will be released in greater quantities once more frozen tundra melts. Also, Siberian forests are more apt to burn as beetle infestations grow larger, just like in the U.S. due to the carbon pollution induced warming trend.
Looking at this global NOAA chart, its no wonder that Russia had a count of 635 DRHMX and only 5 DRLMN during March:
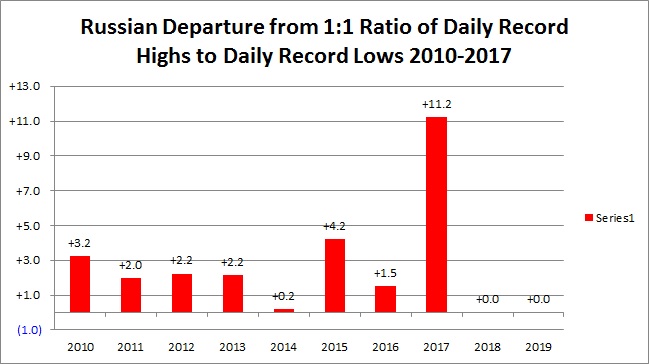
Lastly, let’s break down the daily ratios for Russia on a year by year basis going back to 1920.
Just Wow! Russia, by far, is having it’s warmest year, so far, comparing ratios of DRHMX to DRLMN. Interestingly, the ratio in 2010 wasn’t a big spike due to the awful summer heat wave that year in Russia:
Just like in the U.S. the 2000’s was a warm decade:
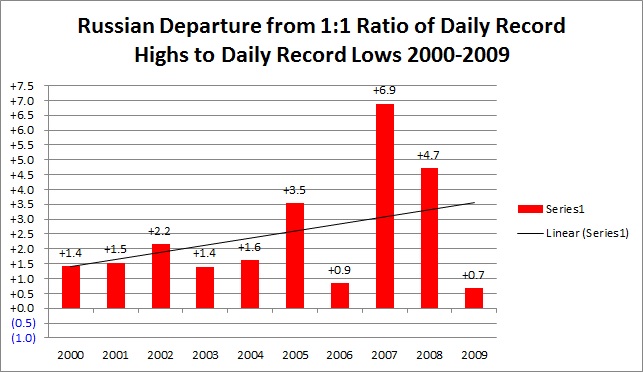
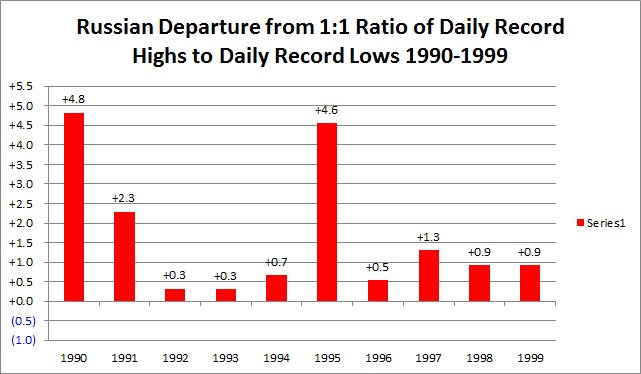
The 1990’s were warm as well, but the smallest ratios are from 1992-93, the two years after the Mount Pinatubo eruption cooled the Earth:
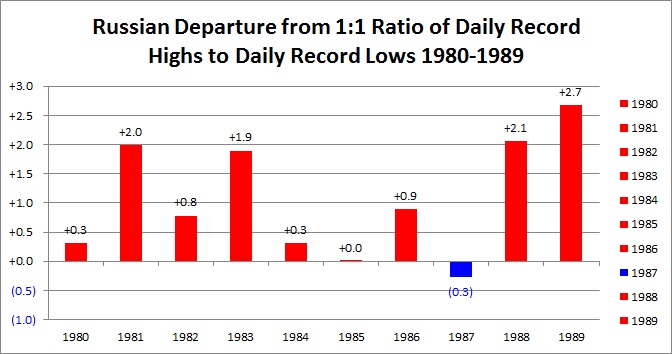
You have to go back to 1987 to find a year of more DRLMN than DRLMX in Russia:
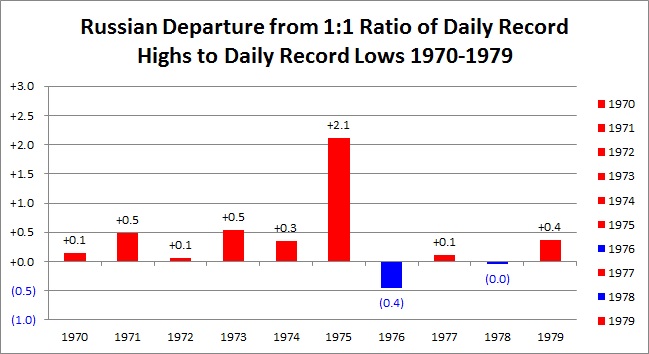
Russia saw a relatively warm decade in the 1970’s as opposed to the U.S.:
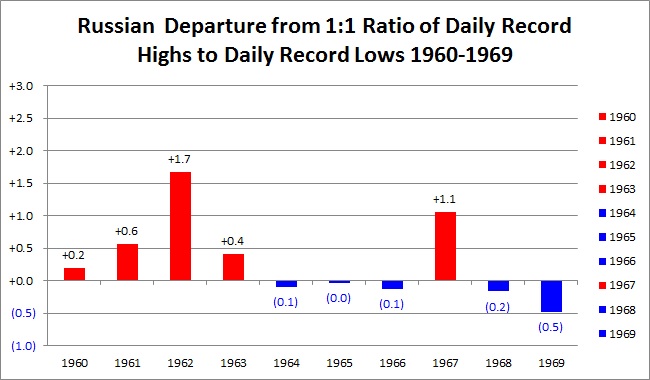
Just like in the U.S. the 1960’s were cooler:
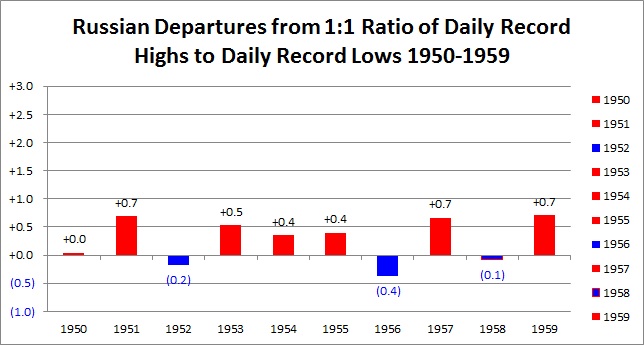
The same goes for the 1940’s and 1950’s:

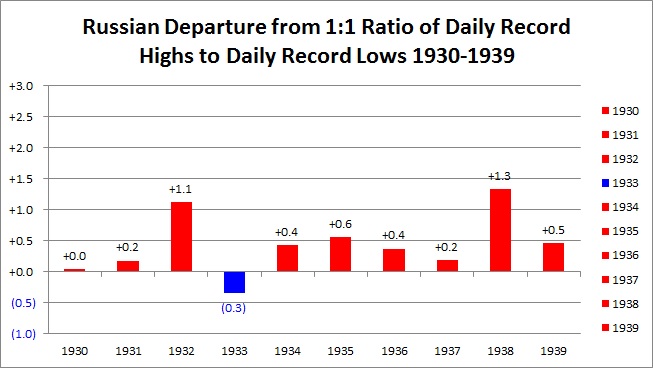
Just like in the U.S. the 1930’s were relatively warm:
You have to go back to the 1920’s to see a decade of more DRLMN than DRHMX in Russia, although there were relatively few reports:

That’s it for now. I will produce part two of this post once I have completed files for Russian daily high minimums and low maximums.
It will be interesting what my science colleagues say about this, which is another small piece of a huge climate puzzle that I have uncovered.
The Climate Guy