Wednesday December 6th… Dear Diary. Here is today’s climate change related topic:
Fire, Fire and more California Fire
Yesterday we discussed at length the weather and climate dominoes falling in place to produce tragic scenarios like the one taking place in Southern California ATTM. My heart goes out to all affected by the fires. I’ll emphasize again the fine work from Daniel Swain has done, which found its way into the Washington Post today:
“UCLA climate scientist Daniel Swain coined the term “ridiculously resilient ridge” to describe the bulging jet stream along the West Coast.”
I think the term ridiculously resilient ridge will be this year’s pet, new meteorological term, but I digress.😊 I’m not going to regurgitate statements from many fine articles today, but will go into the meteorology of forecasting how long the fire weather will last in California to produce scenes like this:
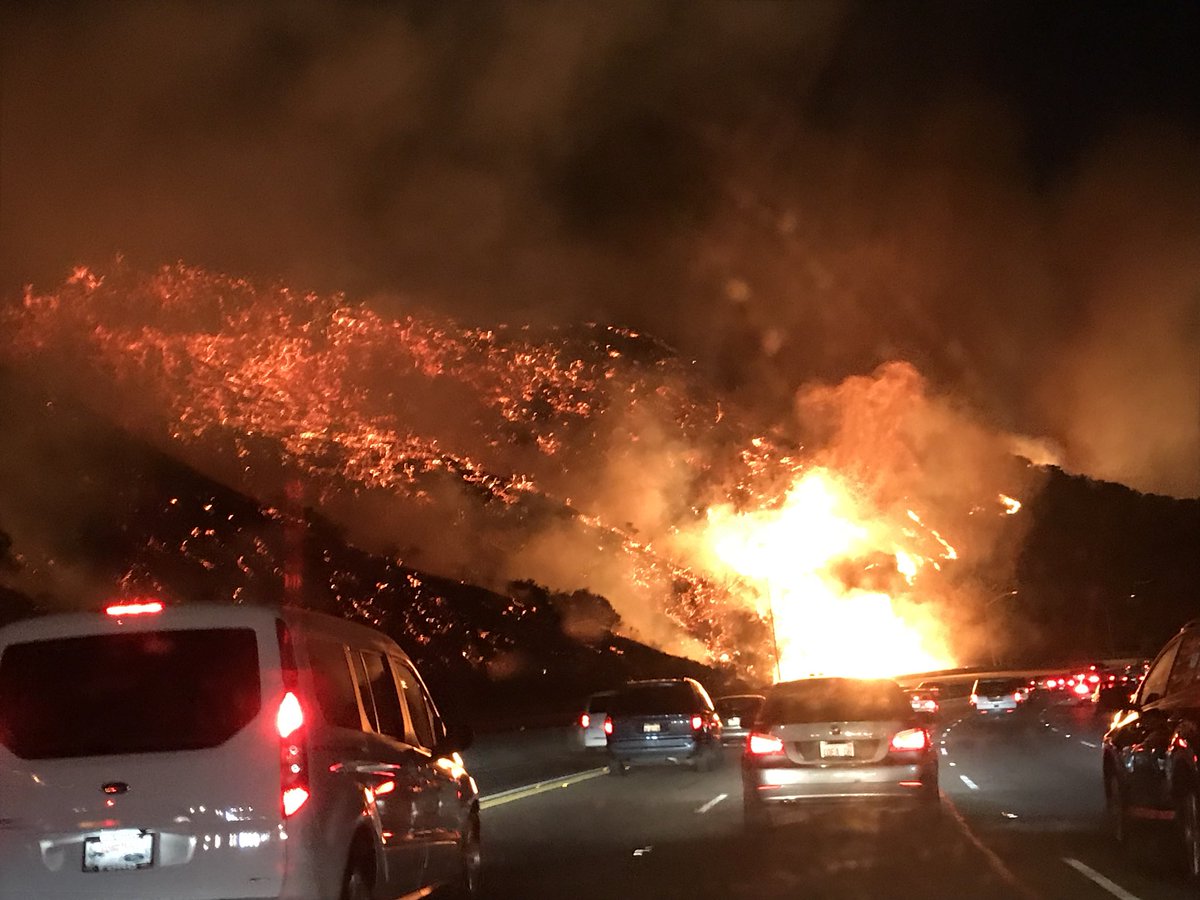
(Image from Rick Patrick #skirballfire)
First let’s review from a graphic here the meteorology behind the Santa Ana winds:
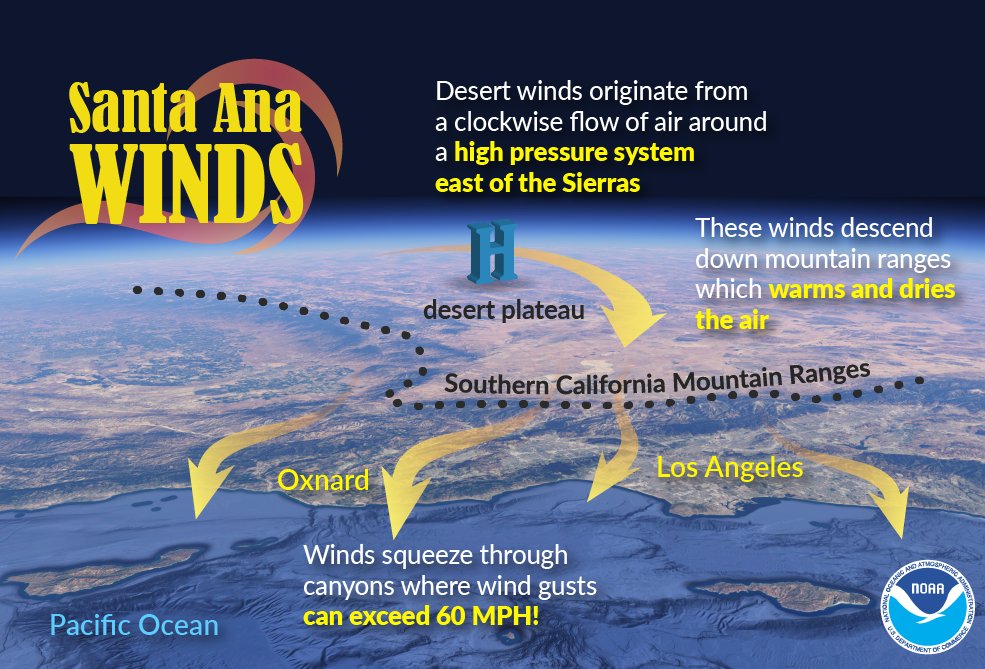
For a more advanced primer see Dr. Marshall Shepherd’s post here:
Second let’s see if there any signs of the ridge (RRR😢) breaking down within 240 hours (my limit for all models). I can’t find any. Here is today’s 240 hour operational model:
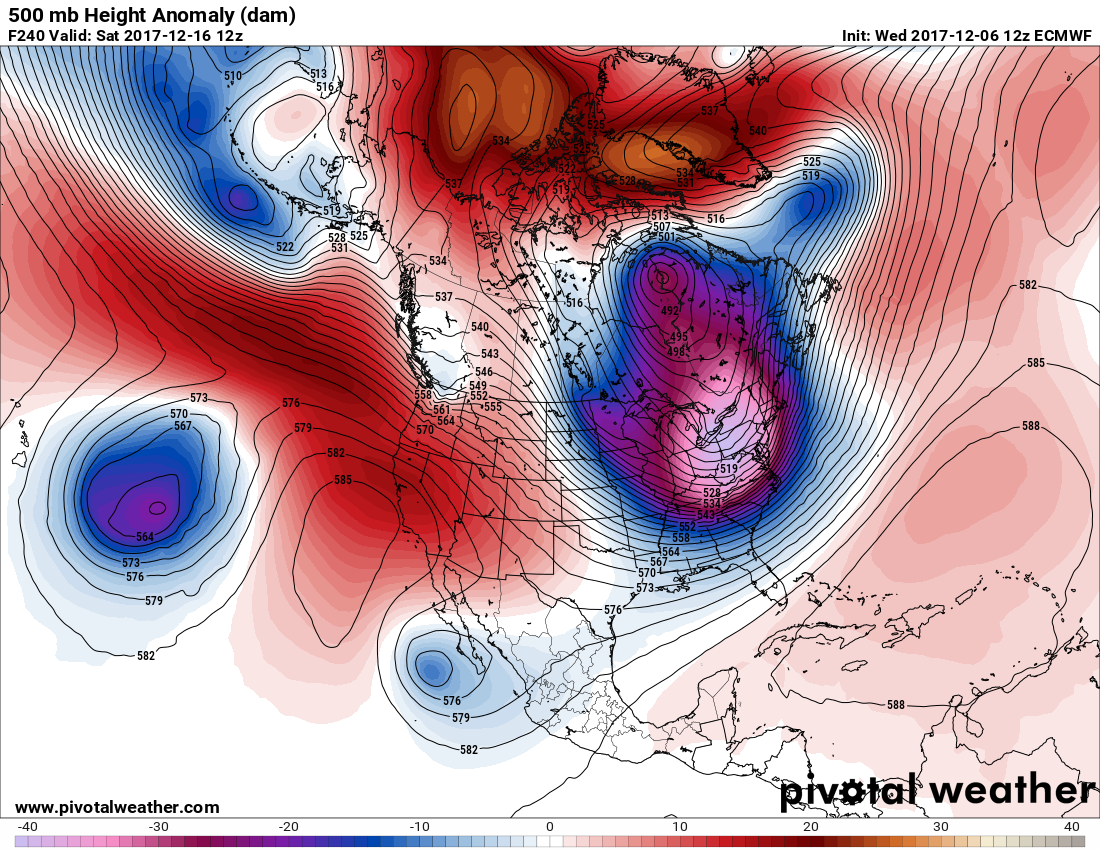
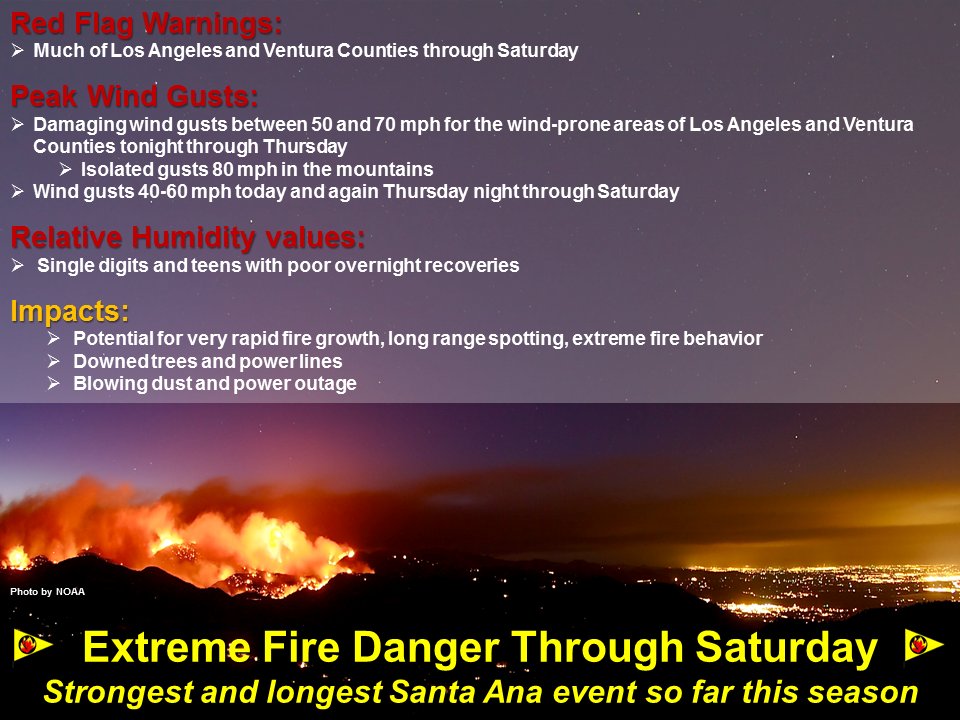
About the only hope for firefighters will come when weak waves or fronts move over the top of the ridge in the Pacific Northwest and northern Rockies briefly weakening the Great Basin surface high producing lighter northeast and east winds. The NWS Los Angeles office is not that optimistic:
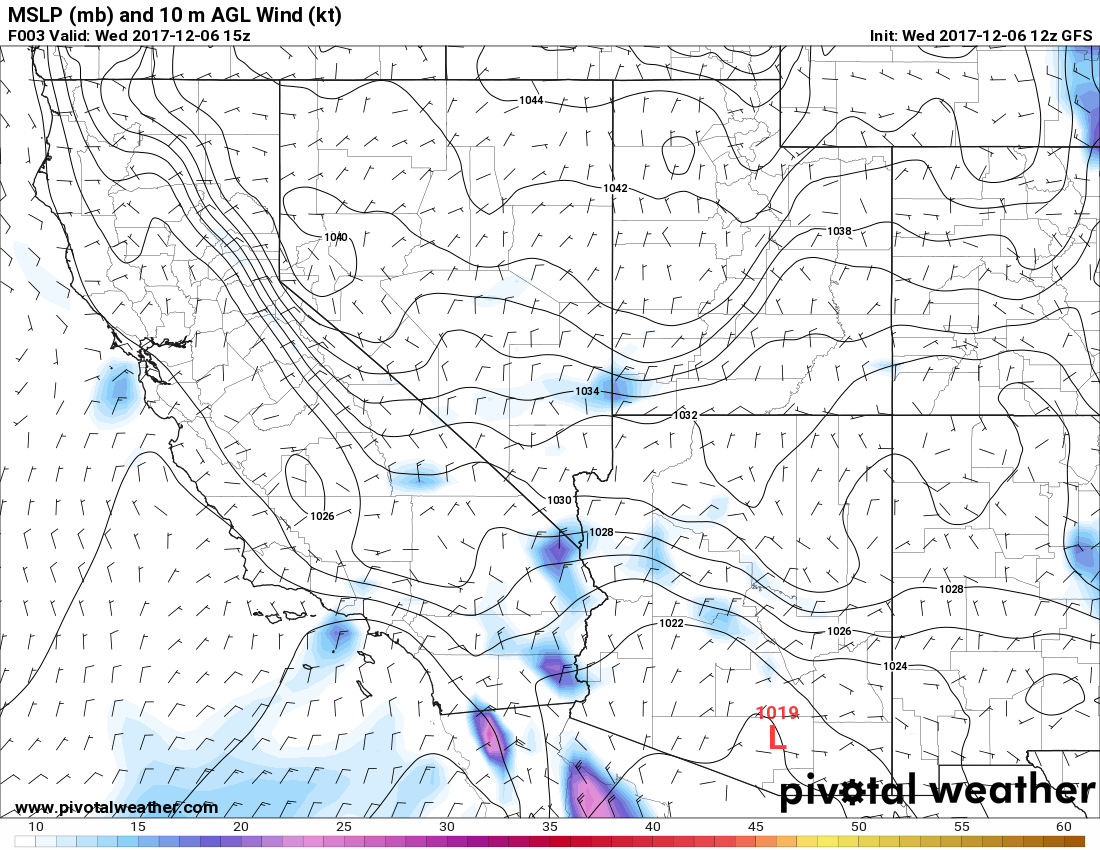
Obviously there will not be any rain to help the situation through mid December, so let me see if I can find a couple of periods when winds will not be so strong. First here was the strong pressure gradient from this morning for reference when fire areas were exploding (Santa Ana winds are usually strongest during the morning hours when the gradient tightens):
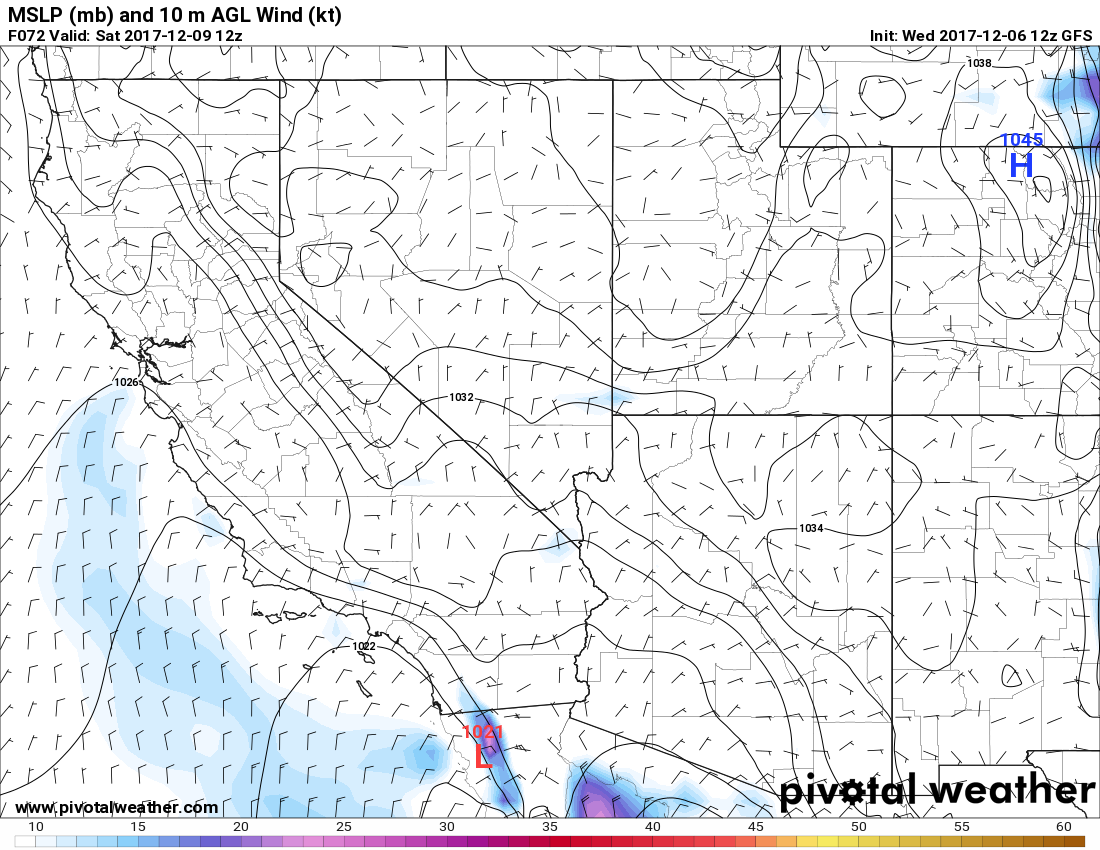
I’m seeing no change through Saturday:

I have to go out to next Thursday to see weaker pressure over Utah, but offshore flow continues in Southern California:
When I look out past 240 hours the gradient strengthens again, alas. You can see the dry air mass on this satellite loop:
Our dry air mass (orange/red colors) seen on water vapor satellite this afternoon is about to get reinforcement. More dry air forming in NV will be here by Thu, combining with strong #SantaAnaWinds in most LA and Ventura Co. valleys and mountains. #LAWeather pic.twitter.com/0fgiexOeLf
— NWS Los Angeles (@NWSLosAngeles) December 6, 2017
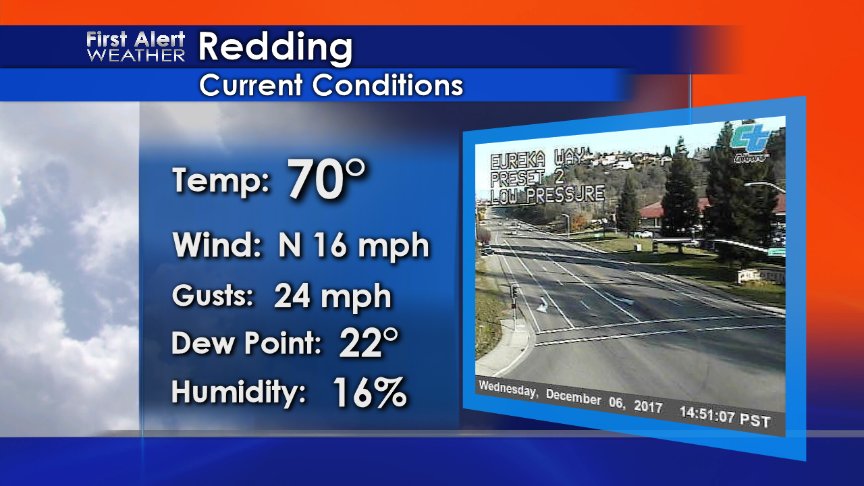
Now let’s turn our attention back to records. I noticed from Rob Elvington that Redding broke a record today of 70F. The old record was 69F, but there period of record is only 32 years:
I’ll add more record information should it cross my radar.
The Climate Guy
Tuesday December 5th… Dear Diary. Here is today’s climate change related topic:
Baked Alaska… and Washington, Oregon and California
A ton of great information has been published the last few days in association with warming and climate change in the West, which has ramifications for the rest of the United States. Let’s work our way from north to south on this topic.
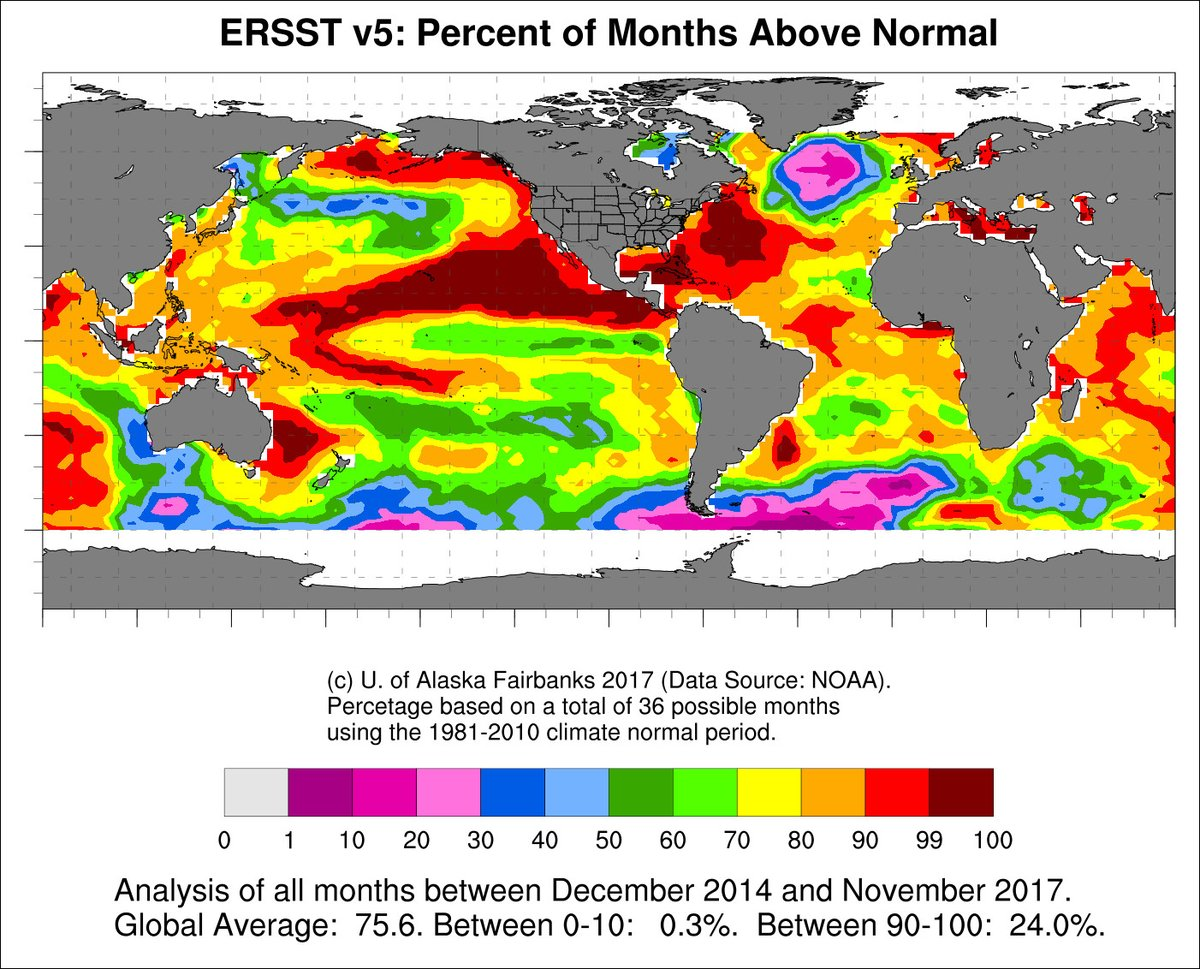
First let’s look at the broad view from climatologist Brian Brettschneider (@Alaskawx): His analysis of SST’s from DEC 2014-NOV 2017 show very warm, above average waters have surrounded North America 100% of the time:
This analysis coincides exactly with my “Streak” of more DHMX than DLMN months recorded here:
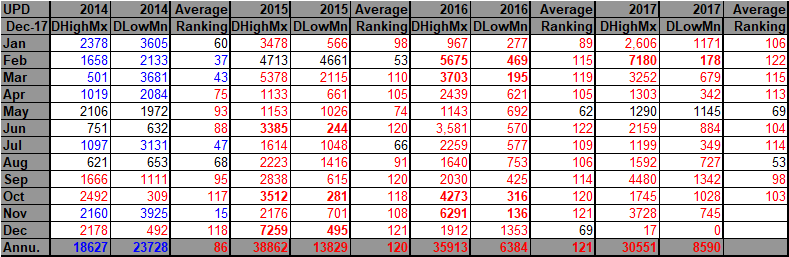
My first point is that warmer than average sea surface temperatures surrounding North America have led to both record warmth across the United States, and as we will see, an anomalous weather pattern in the West.
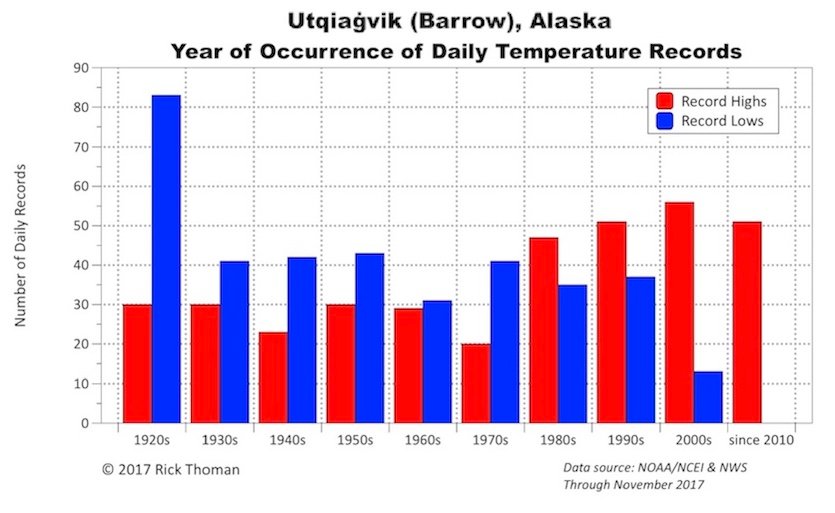
Second lets look at baked Alaska. Chris Burt writing for Weather Underground looking at record counts shows how anomalously warm it’s been this decade at Barrow with a tie in to diminishing Arctic sea ice:
From the article: “During the time frame of December 2015-November 2017, a total of 25 daily record highs have been set versus zero (0) daily record lows. In fact, the last time Utqiaġvik set a daily record low was almost a decade ago—on December 21, 2007, when a reading of -42°F was achieved. Given its period of record (POR) of 96 years, Barrow should expect to see an average of 4 daily record highs and 4 daily record lows established each year. So for the period from January 2008 through November 2017, we would expect a total of about 37 daily record highs and 37 daily record lows set if the climate were in perfect equilibrium. In fact, the total number of daily record highs set in this span has been 71, versus (as mentioned) zero daily record lows. Yes: a 71-to-0 ratio over the past ten year period.”
Third, and more broadly, Daniel Swain (@Weather_West) has written an excellent technical article on how all of this warmth is locking in the western ridge over the West, exacerbating dry conditions leading to more Santa Ana wind regimes highly exasperating fire potential. I applaud Daniel’s efforts, which should lead to better regional climate models:
http://weatherwest.com/archives/5982
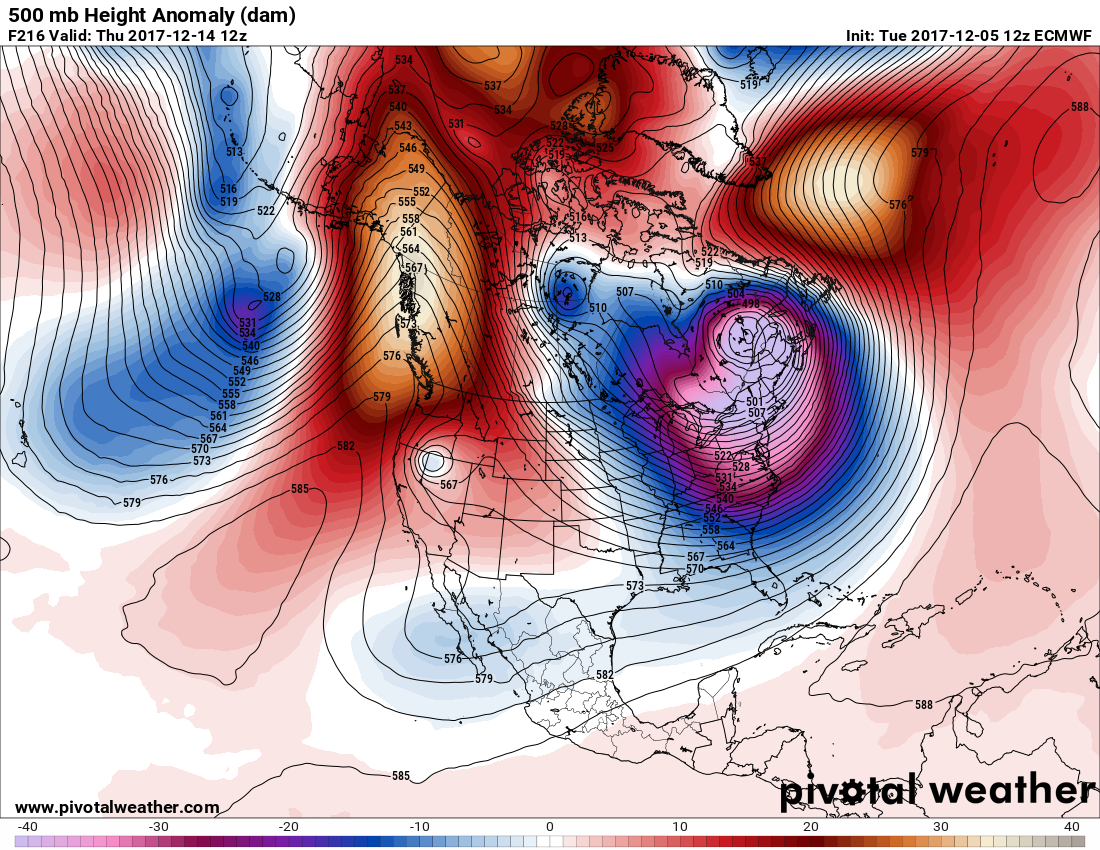
Remember in my past Heat and Cold Diary logs that I have often mentioned that weather and climate act like a set of dominoes… if all are lined up properly you will get certain reactions. That’s the case here leading to a strong persistent western ridge anchored over the Pacific coastal states:
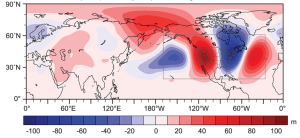
From the article: Composite middle atmospheric pressure anomaly map corresponding to extreme North American temperature dipole days. (Adapted from Singh et al. 2016) Daniel Swaim goes into great detail showing how the warmth coincides with the prior record California five year drought and the current dry weather pattern, which also is in association with the La Niña domino:
In turn, as was the case for much of 2013-2014, much of the East had cold or cooler than average conditions partially due to what Daniel terms “The Ridiculous Resilient Ridge.” I strongly suspect that the record warm El Nino of 2015/2016 aided to break up this pattern allowing California to get a wet break. Again the current dipole will lead to very chilly, below average conditions for the East through at least Christmas looking at trends (Here is the latest operational model valid next week):
In conclusion, we can identify and chart the following weather and climate dominoes that have been affected by carbon pollution: 1) warmer than average SSTs 2) record warmth 3) falling sea ice coverage in this case near Alaska’s north shore 4) The Ridiculous Resilient western Ridge leading to 5) more drought and Santa Ana winds leading to 6) exacerbated fire potential in California… also 7) the dipole leading to some cold snowy winters in the East. 8) ENSO interacting with the prior seven dominoes
Please read both articles presented today for greater scientific understanding of how these eight climate and weather dominoes are falling unto place.
For more on the current odd December fire potential in California in association with the Santa Ana winds see Bob Henson’s post here:
https://www.wunderground.com/cat6/extreme-weeklong-fire-threat-puts-southern-california-edge
By Wednesday of this week we finally will see a typical temperature regime across the CONUS:
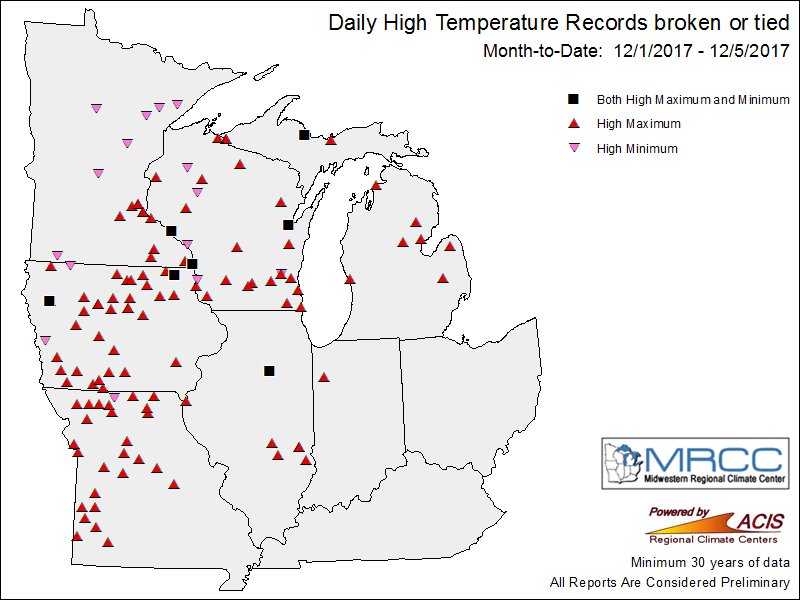
Here are some amazingly warm records from the usually for this time of year frozen Great Lakes ahead of a strong front. Some of the Period of Records were from the 19th century:
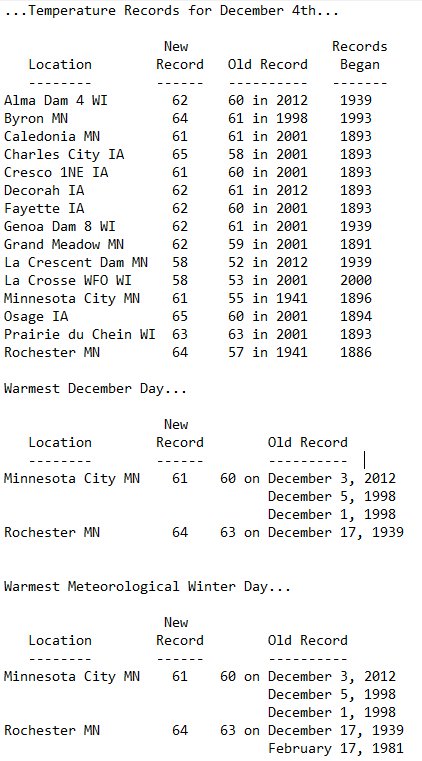
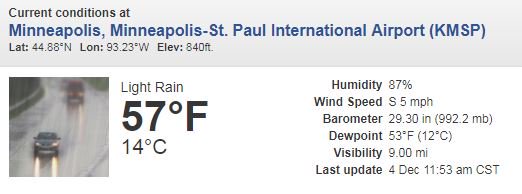
Minneapolis set a daily record high of 57F, which was just as warm as the average high in Atlanta on the 4th. Yikes! (Although this time of the year this warmth is welcome as I keep writing and saying.😉)
The record high temperature has been broken in the Twin Cities today! As of noon it was 57 degrees. Previous record was 56 set in 1941. #mnwxpic.twitter.com/PI7AOlZilq
Yes it’s been warm across the Midwest where more than 100 daily and monthly record highs have been broken in early December:
The Climate Guy
Monday December 4th… Dear Diary. Here is today’s climate change related topic:
Unlivable American Cities Due To Climate Change?
I hate to keep playing the part of Debbie Downer, but there is a real existential threat of some U.S. cities becoming unlivable either because of sea level rise, drought, or just plain heat by mid-late century. So which major cities do I consider to be most at risk for at least becoming partially uninhabitable and for what reason? Here is my top five list:
1) Miami (sea level)
2) New Orleans (sea level)
3) Phoenix (heat and drought)
4) Las Vegas (heat and drought)
5) Los Angeles (drought and heat)
Pheonix is #3 on my list. Today an article has come out in why I put Phoenix at number three:

(Illustration from the article by Corey Brikley)
From the article: “Phoenix is currently the fastest warming big city in the US,” meteorologist and former Arizonan Eric Holthaus told me in an email. A study from Climate Central last year projects that Phoenix’s summer weather will be on average three to five degrees hotter by 2050. Meanwhile, that average number of 100-degree days will have skyrocketed by almost 40, to 132, according to another 2016 Climate Central study. (For reference, over a comparable period, New York City is expected to go from two to 15 100-degree days.)
Number five on my list is Los Angeles, which has been undergoing a lot of climate change related stress this past decade mainly due to the last five year drought. Could another drought be brewing due to this yearly nascent winter weather pattern? Certainly the upper ridge building over the West looks ominous. The warm ridge in combination with a low level surface high over the Great Basin will produce a bad Santa Ana wind regime in the L.A. Basin to produce high fire danger for days to come:
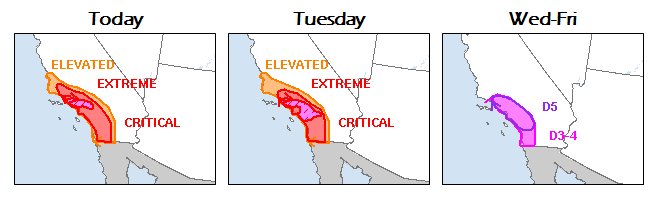
(Graphics from Alex Lamers)
We’ll go into more detail of threats to the “list” on future posts. Also, depending upon future data that my radar comes across I might rearrange the deck chairs (reorder the list).😁😢.
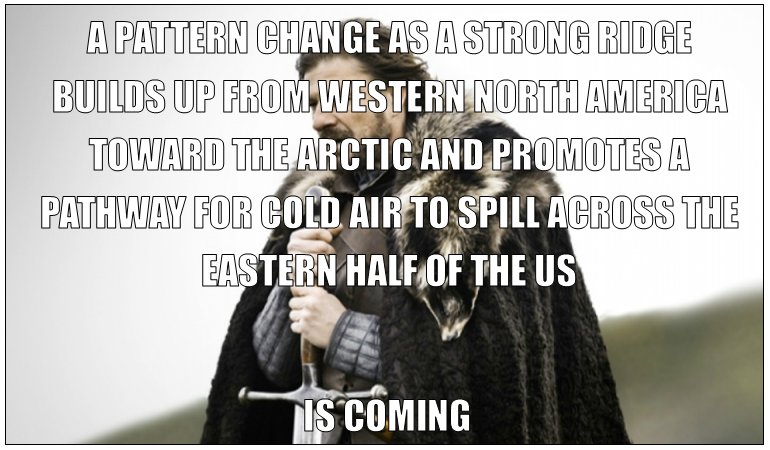
There certainly will be a cold pattern in the East this month. Yes… barring a Game of Thrones saying:
There is a good chance for at least spotty reports of record cold from the Great Lakes into the Northeast if the European model is correct from the 12Z MON run:

It will be interesting to see if we get more stations reporting record warmth from the ridge in the West or more from the cold trough in the East this December.
The Climate Guy