Saturday January 6th… Dear Diary. The main purpose of this ongoing post will be to track United States extreme or record temperatures related to climate change. I’ll refer to extreme temperatures as ETs (not extraterrestrials)😊. Here is today’s climate change related topic:
Baby It’s Cold Outside!
If you are living in the Midwest or anywhere east of the Mississippi River this weekend you are wondering where is global warming? We’re seeing record cold. What happened? My answer to these questions is that while the overall trend is for average temperatures of the planet to go up, the atmosphere can still at this point in time produce mighty cold weather regimes. Remember that climate is the overall trend or averages of weather over months and years.
Well that underperforming due to carbon pollution “cold team” has certainly been racking up the points the last week. It’s the start of 2018 in January and surprise! We finally see some blue on the NCEI “record score board” (all set or tied record individual counts reported from https://www.ncdc.noaa.gov/cdo-web/datatools/records):

Ever since the start of the amazing “streak” of 37 consecutive months of more daily record highs than lows set across the U.S. in December 2014 I’ve not seen the atmosphere stacked to produce a colder than average month until now. There will be another substantial number of daily record lows (or ETs) set in the Northeast on Sunday the 7th added to the scoreboard, so there will need to be a significant January thaw to prevent the “cold team” from finally winning at least for the period of one month.
Let’s break down some record numbers set so far during this historic cold wave, which started in the northern Plains on 12/26/18 when a strong arctic high began to infiltrate the United States:
DHMX DHMN DLMN DLMX
763 446 1,541 2,918
The numbers are colored in blue (representing cold on all my stat charts) since there are far more record cold reports than warm.
If it wasn’t for the toasty Southwest there would have been very few reports of daily record high maxes or minimums since 12/26. Meteorologically the dipole establishing a deep penetration of an extension of the old polar vortex into the eastern U.S. is to blame for the cold. Due to a strong El Nino combined with global warming from 2015-2017 we didn’t see the dipole develop, and there were very few intrusions by the polar vortex into the U.S. those years leading to a lot of warmth. The polar vortex was strong from 2013-2014 after the U.S. had a record warm 2012.
We’ll see if 2018 will be similar to 2013-2014 weather wise. It certainly has started out that way with a drought rearing its ugly head again in California and a historic cold wave in the East. Carbon pollution may tip the scales toward warmth by this summer, though, which would be a bad thing for agriculture and people not prepared for record heat.
There are strong signs that our historic cold wave will be over by Tuesday the 9th with Pacific air taking over most of the lower 48 states:
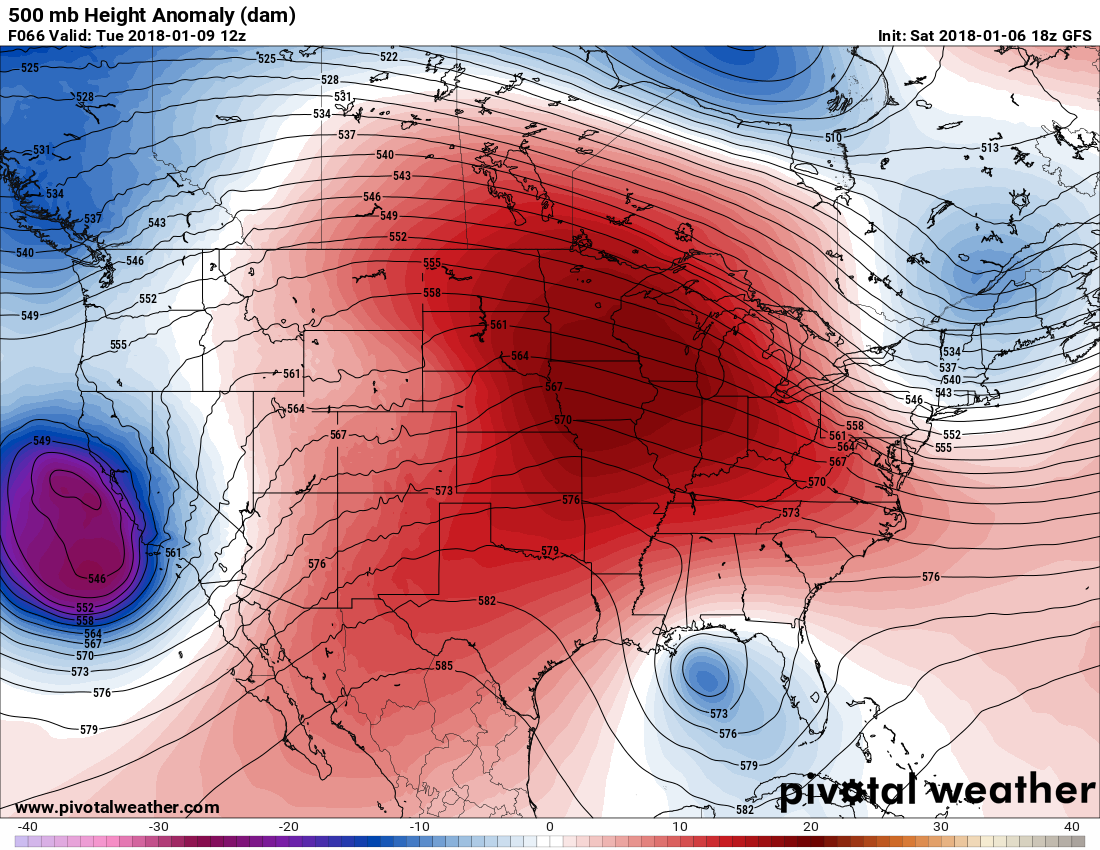
Daniel Swain’s researched dipole of a strong ridge along the West Coast with the Hudson Bay low digging into the U.S., persisting longer due to climate change, will finally break down allowing a strong system, as shown in the above chart, to move into California where much needed precipitation will fall. Sometimes every good cloud does not have a silver lining however:
 Daniel SwainVerified account @Weather_West
Will there be significant record warmth after the 9th? We will see.
The Climate Guy
……………………………………………………………………………………………………………………..
Friday January 5th… Dear Diary. The main purpose of this ongoing post will be to track United States extreme or record temperatures related to climate change. I’ll refer to extreme temperatures as ETs (not extraterrestrials)😊. Here is today’s climate change related topic:
What does the Bomb Cyclone Have to do with Global Warming (Part 3)?
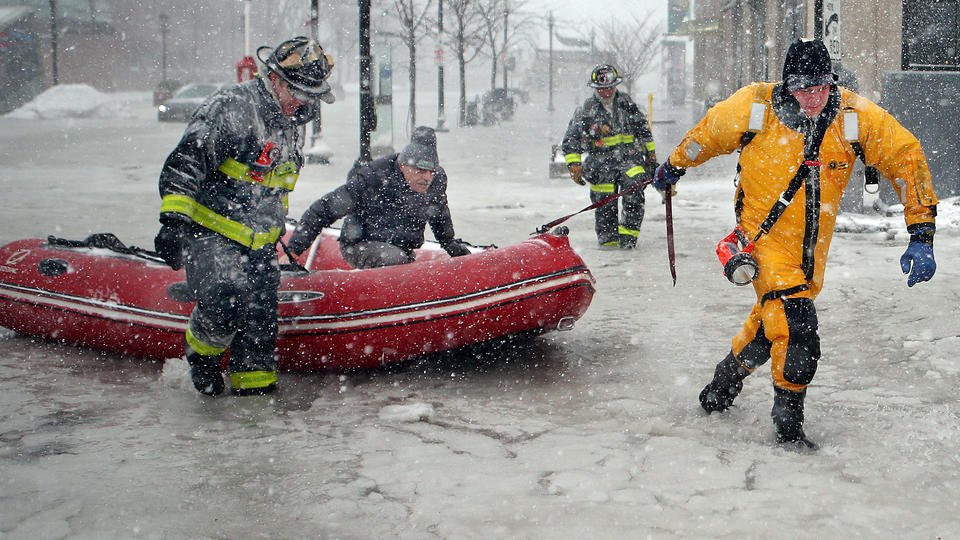
The last point to be made in association with yesterdays impressive Winter Storm Grayson is that partially due to sea level rise that has already occurred from global warming we saw record storm surge and coastal flooding in the Northeast. For example, check this out:

[OFFICIAL] Boston has broken the highest ever recorded tide since 1921. New Record: 4.88′ MHHW (or 15.16′ MLLW) on January 4th, 2018. Old Record: 4.82′ MHHW (or 15.10′ MLLW) during the Blizzard of ’78.
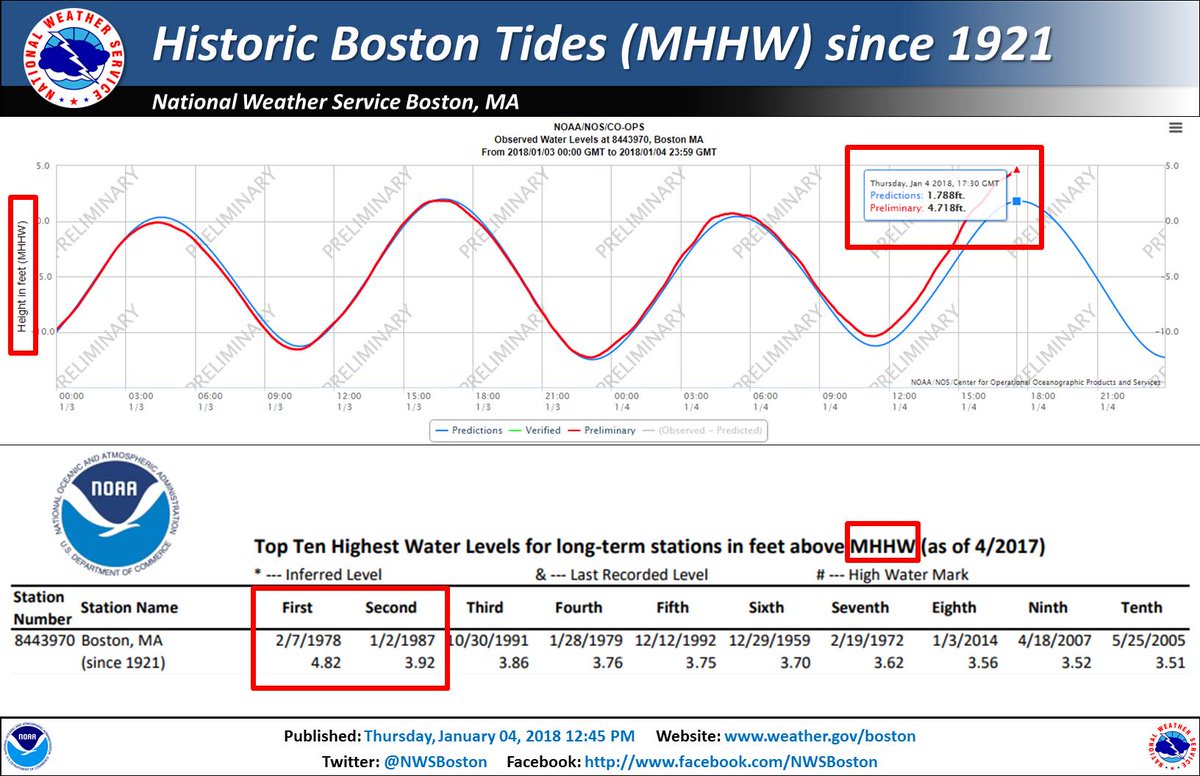
Boston, MA: 4.88’ above MHHW, highest on record; previous record 4.82’ on 2/7/1978 during the infamous Blizzard of ’78 (period of record, or POR, since 1921)
Bar Harbor, ME: 3.67’ above MHHW, highest on record; previous record 3.56’ during the December 29, 1959 nor’easter (POR since 1947)
Nanucket, MA: 3.79’ above MHHW, second highest on record, behind the 4.29’ observed on 10/31/1991 during the “Perfect Storm” (POR since 1965)
Portland, ME: 3.89’ above MHHW, third highest on record, behind the 4.22’ on 2/7/1978 and 4.03’ on 1/9/1978 (POR since 1912)
 The planet’s climate works like a big set of dominoes, except that one domino, such as a dominoe falling in Antarctic, can make another fall on the other side of the planet in New England.
 Bill McKibbenVerified account @billmckibben
Before spending a few billion on a sea wall, might want to divest from the fossil fuel companies causing the trouble. An ounce of prevention…

 :Karen Crandell Morse
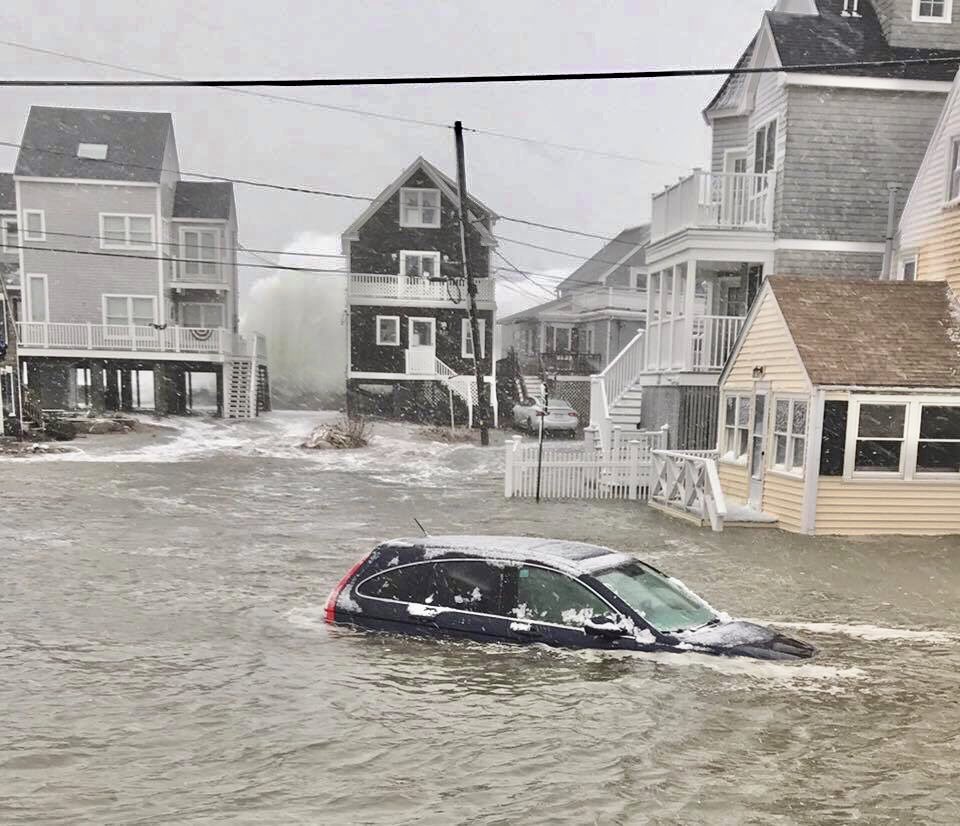
 NWS Eastern RegionVerified account @NWSEastern
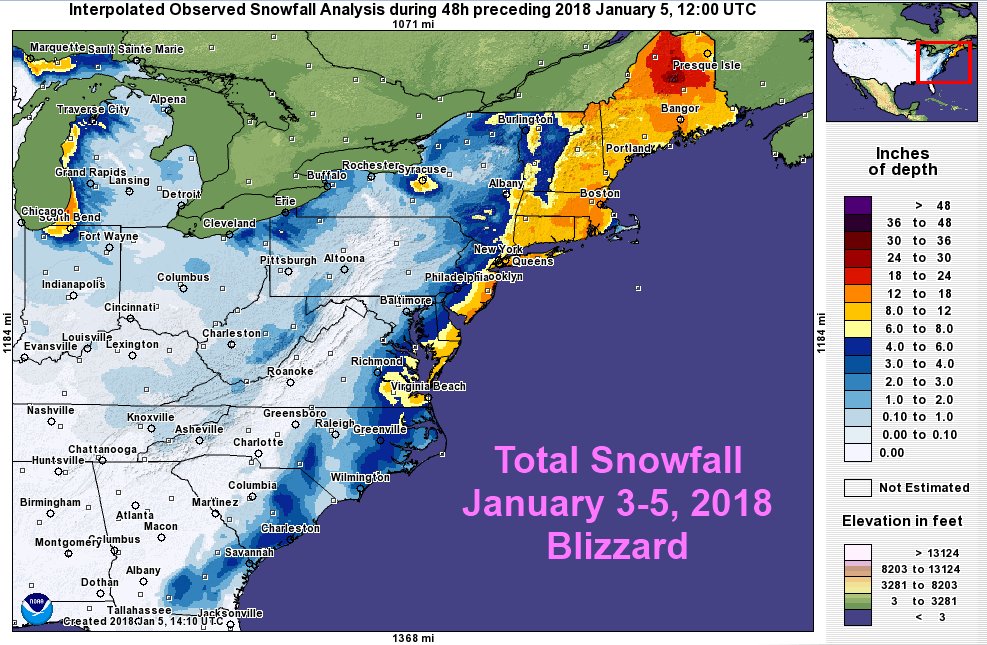
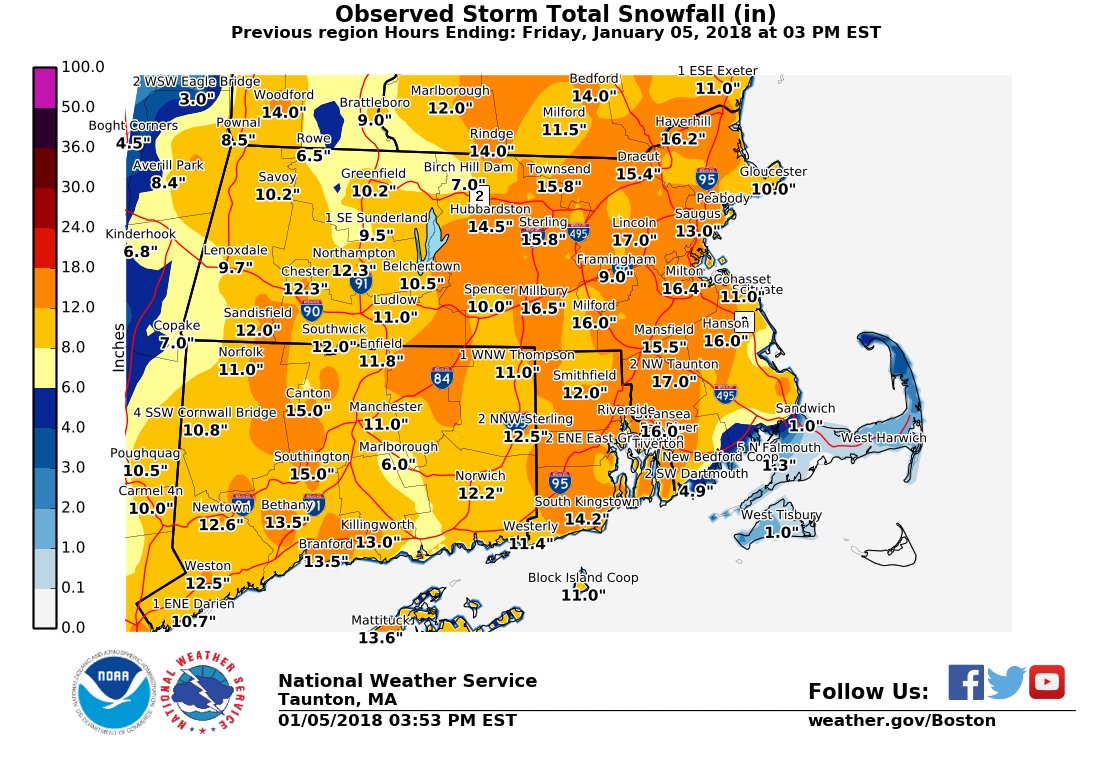
[4pm] Here are the latest snow totals from yesterday’s Nor’easter.
NWS Eastern RegionVerified account @NWSEastern
 Ryan Maue | weather.usVerified account @RyanMaue


