Saturday January 20th… Dear Diary. The main purpose of this ongoing post will be to track United States extreme or record temperatures related to climate change. I’ll refer to extreme temperatures as ETs (not extraterrestrials)😊. Here is today’s climate change related topic:
ENSO Peaks and Valleys… Comparing 2016 with 1998
Segueing from my posts of the last two days presenting 2017 global temperature averages and forecasts, I’d like to point out as a bit of a warning to my climate science friends and all reading that contrarians will point to a period after a peak or spike on charts, suggesting that there is no warming trend or that a “global cool down is imminent.” I saw this play out last decade after the record El Nino of 1998, and it may happen again after the strong El Nino of 2016. How often did I read “global warming has stopped since 1998?” Global temperature average trends on charts may not rise very much or might even go down slightly the next few years after 2016. This doesn’t mean that global warming has halted, just that averages are bound to come down some after a strong El Nino ends.
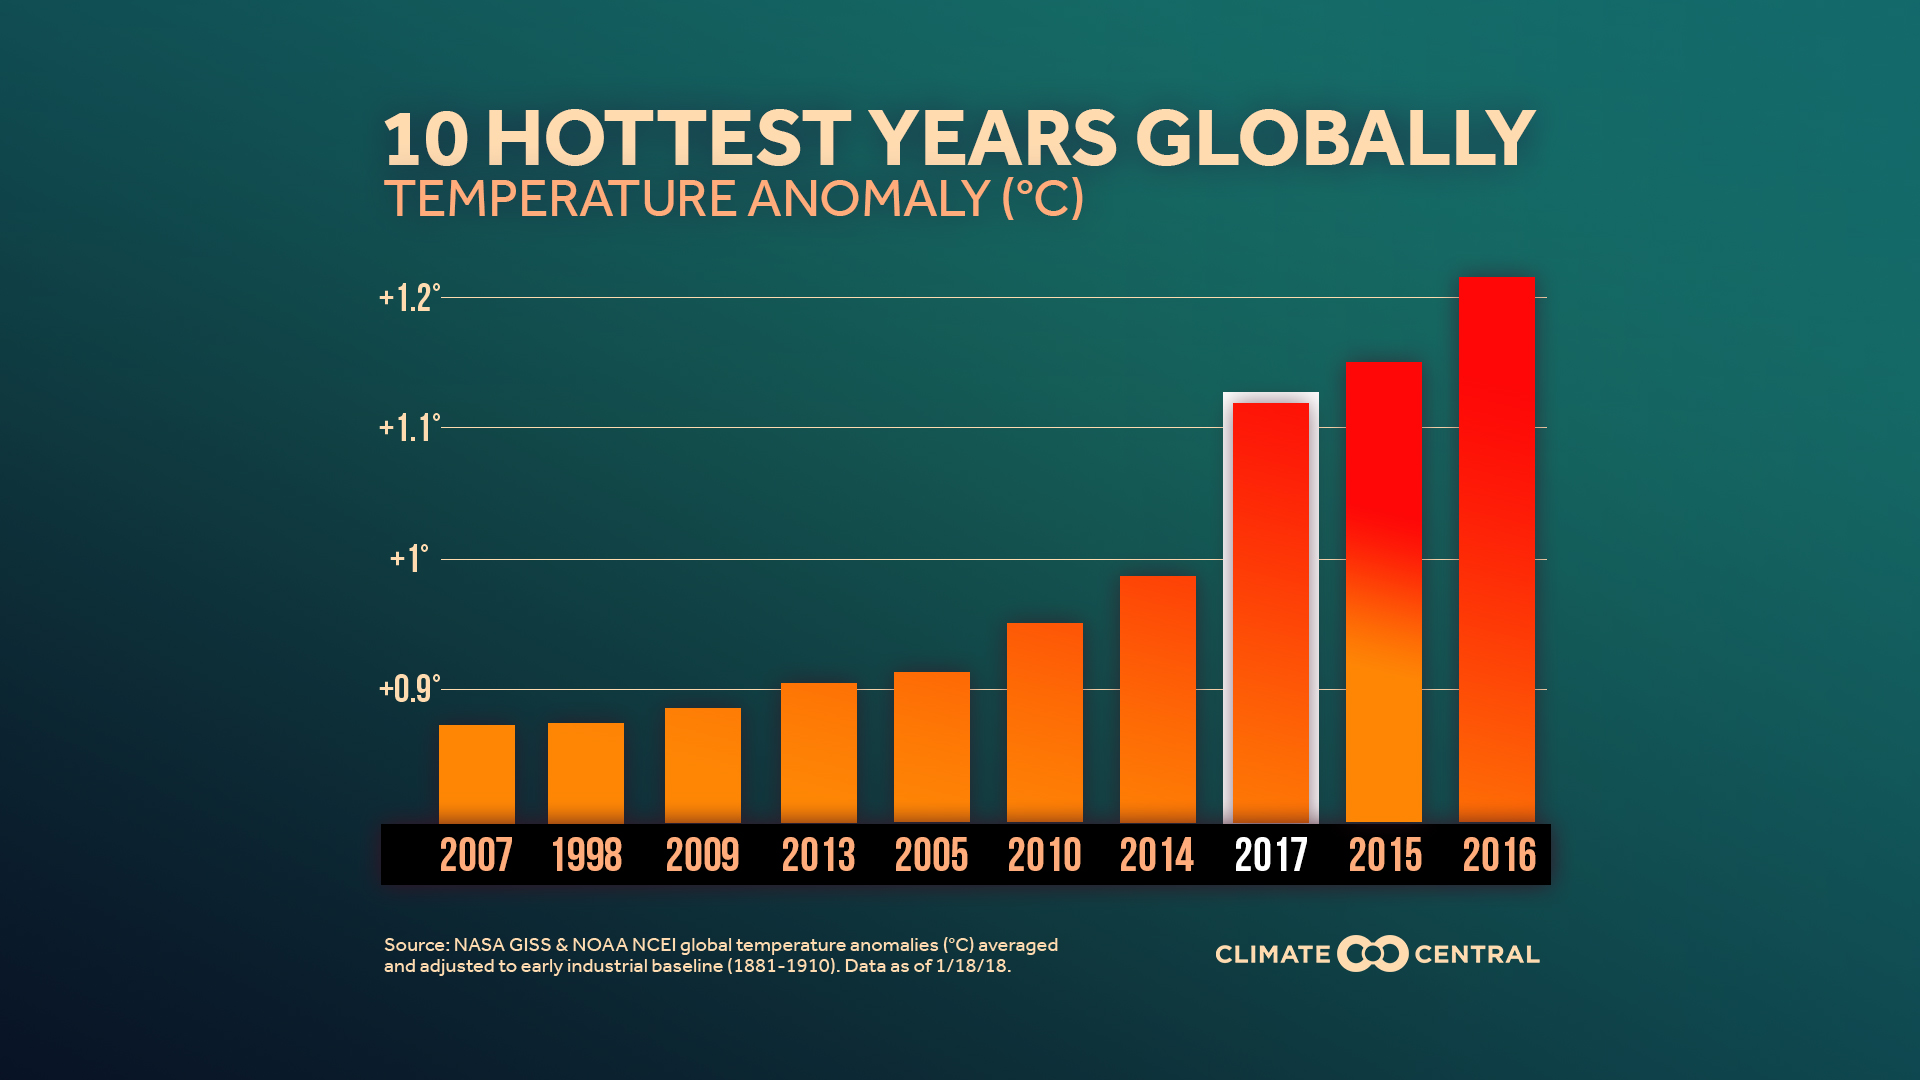
The last three near record strong El Ninos occurred in 1983, 1998, and 2016 with roughly 15 years between the big events. Looking at this trend we may not see another whopper of an El Nino until about the year 2031. Once another strong El Nino occurs we are likely to see another huge spike in global average temps just like in 1998 and 2016 with a new yearly record being set pretty far above prior years. Will global warming end between now and that future year? Of course not unless there is a big uptick in volcanic activity. To get a good idea how anomalously warm the next record hot year might be during a strong El Nino year we can compare 1998 with 2016. Looking at this Climate Central bar graph it’s apparent that 1998 is hanging on as the last year from the 20th century ranked on this top ten chart:
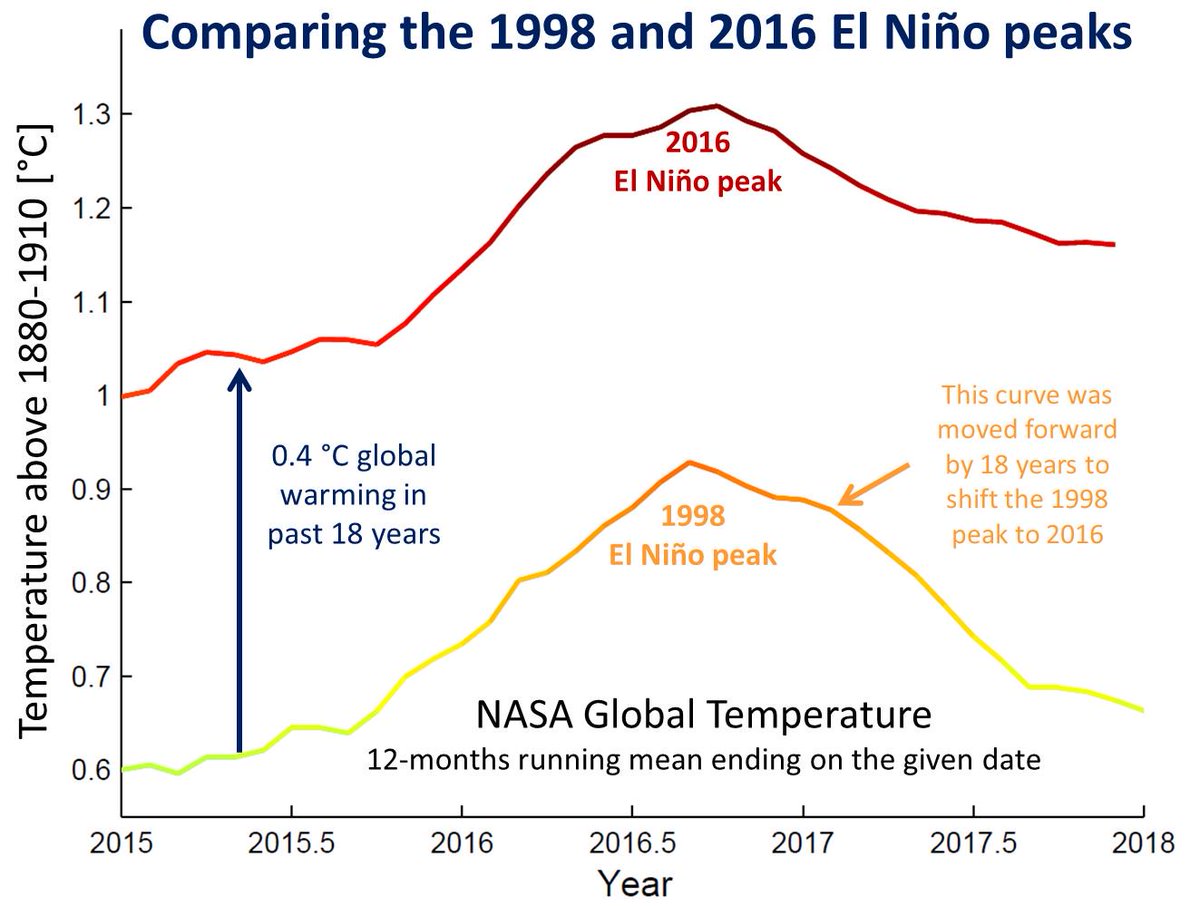
I spied this graph made by climate scientist Stefan Rahmstorf the last couple of days, which shows nicely how much warmer the world was in 2016 compared with 1998: