Monday January 29th… Dear Diary. The main purpose of this ongoing post will be to track United States extreme or record temperatures related to climate change. I’ll refer to extreme temperatures as ETs (not extraterrestrials)😊. Here is today’s climate change related topic:
Graphic Putting Global Warming in Perspective
Those who know me have come to understand that I really like stark, simple charts that convey great climate information for the public. Here is a new one I came across over the weekend from KarlMagnus Petersson (@kpetersson), which I’ll briefly unpack :

What I’d mainly like to point out on the chart is the blue line representing the temperature range of the Holocene, or most recent geological epic of the planet. At the dawn of civilization until now global averages have not been above .9C above the average of the mean for the Holocene. The Holocene can be defined as: “The current geological epoch which started some 11,500 years ago when the glaciers began to retreat. This retreat marked the end of the glacial phase of the most recent ice age. Its character was set by the spread of forests as the ice retreated and then by their shrinkage as mankind’s demand for timber and agricultural land grew. Although we think of the Holocene as a warm time for the planet, we are still in an ice age. This is indicated by the presence of ice caps at the poles – the planet as a whole is just in an interglacial phase.” Quoting from:
http://www.bbc.co.uk/nature/history_of_the_earth/Holocene
It’s taken hundreds of years for the knowledge from geologists and paleo climatologists to help put this chart together. The planet has not been this warm in literally millions of years.
Ever since its dawn about 3000 BC civilization has thrived in a relatively stable climate. The chart indicates, as do a myriad others, that we are going to move well beyond the global average we as a species are accustomed to (in red and orange). The chart uses the A1B moderate emission scenario, which would indicate that warming would be about +3.0C by 2100 over the Holocene average. Starkly, the graph looks like Dr. Mann’s Hockey Stick, and should spur people to action. Can we take the stresses that nature will deal out from this point in time in the 21st century onward? I’ll leave this as an open question.
………………………………………………………………………………………………………..
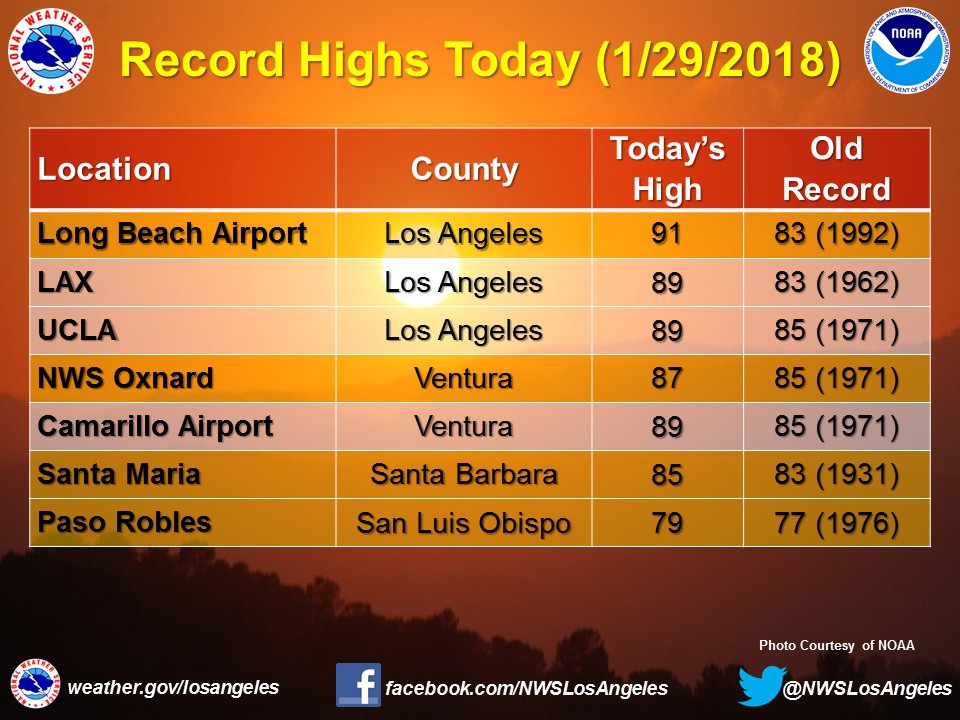
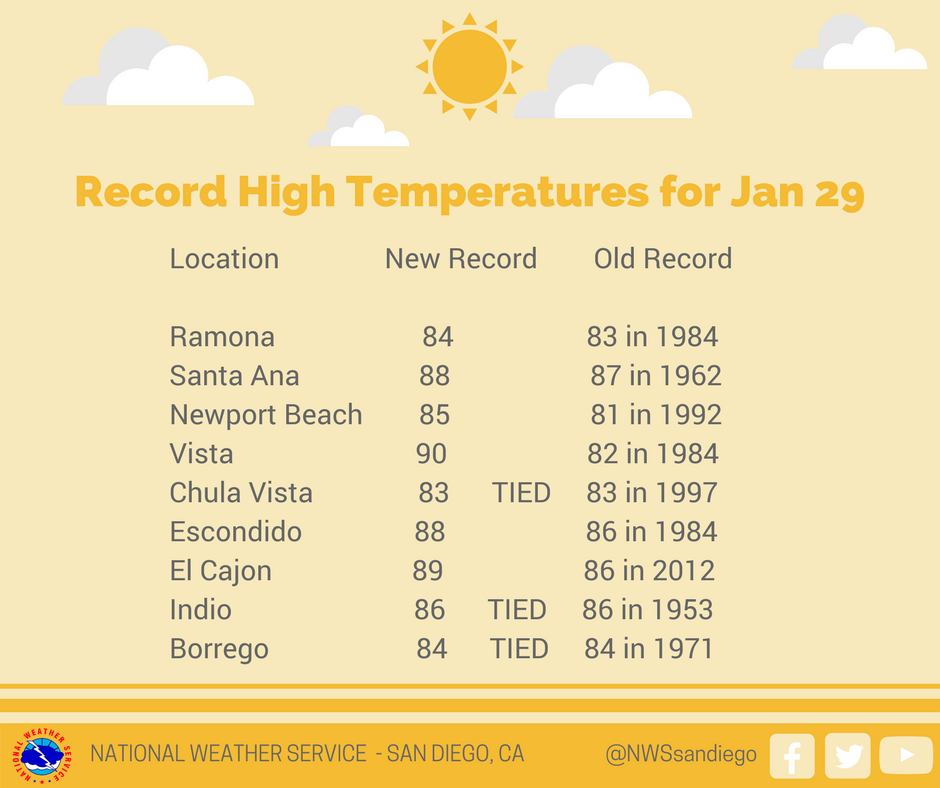
Here is today’s list of toasty records from the Southwest:
#ClimateFact Current temp at SLC Airport: 56°F. This breaks the daily high record (prev 55°F set in 1911). The normal high for late Jan is 39°F. #utwx

RECORD EVENT REPORT
NATIONAL WEATHER SERVICE PHOENIX AZ
0526 PM MST MON JAN 29 2018…RECORD HIGH TEMPERATURE SET AT PHOENIX AZ…A RECORD HIGH TEMPERATURE OF 83 DEGREES WAS SET AT PHOENIX AZ TODAY.
THIS TIES THE OLD RECORD OF 83 SET IN 1935.

 NWS San DiegoVerified account @NWSSanDiego
The Climate Guy


