Monday March 12th… Dear Diary. The main purpose of this ongoing post will be to track United States extreme or record temperatures related to climate change. Any reports I see of ETs will be listed below the main topic of the day. I’ll refer to extreme temperatures as ETs (not extraterrestrials)😊. Here is today’s main climate change related topic: (If you like these posts and my work please contribute via the PayPal widget, which has recently been added to this site. Thanks in advance for any support.)
Diminishing Record Low Counts
Earlier today I was part of an interesting discussion concerning my sole semi claim to fame in the climate world, the 2009 Meehl Record Study. Here is the first version published in 2009: http://onlinelibrary.wiley.com/doi/10.1029/2009GL040736/abstract
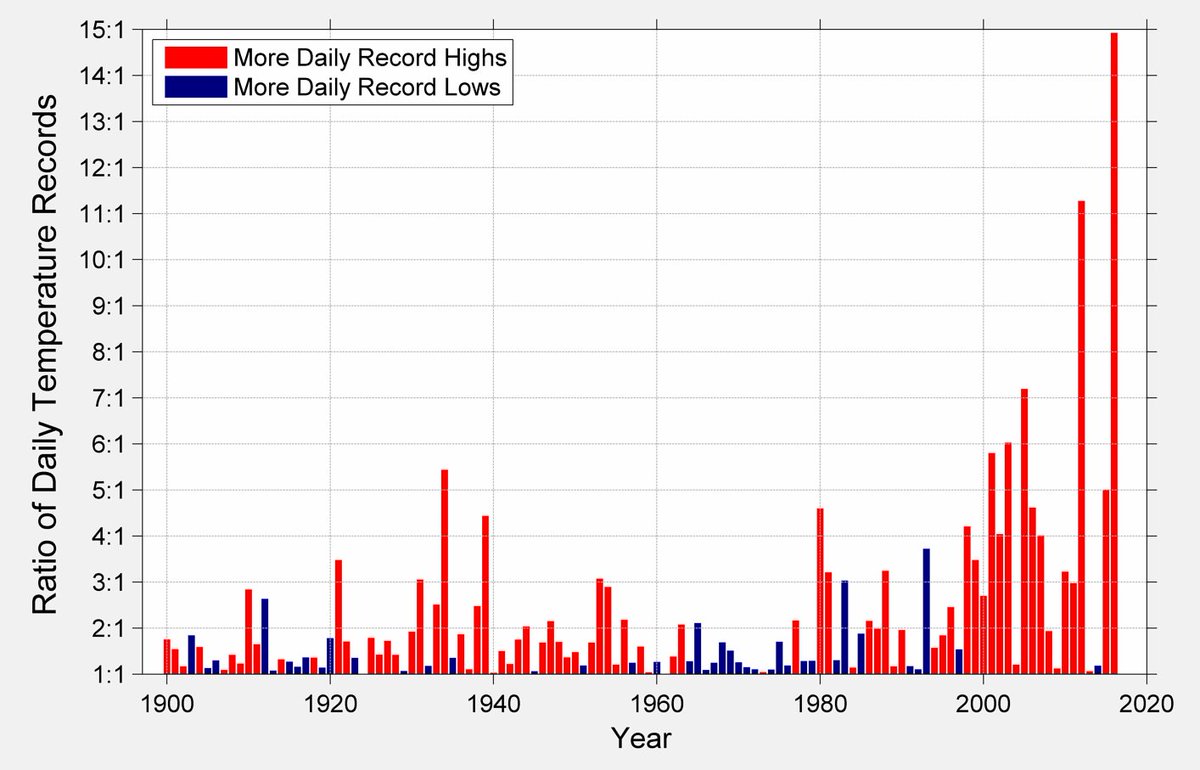
In 2015 Dr. Jerry Meehl’s team produced an updated version of the Surface Record Study predicting that the ratio of daily record surface maxes to minimums wwould be about 15 to 1 by the year 2100: http://www.pnas.org/content/113/49/13977
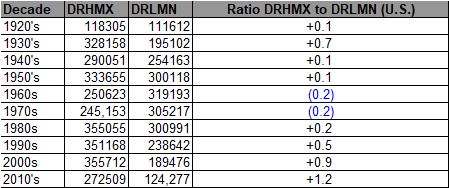
By climatological standards these study predictions are in their infancy, but indeed the baby is starting to mature quite rapidly. We are already seeing an increase in the ratio of record DHMX to DLMN from the decade of the 2000s to the 2010s, as would be expected in a warming world, with 22 more months to catalogue for this decade using the kitchen sink of NCEI statistics:
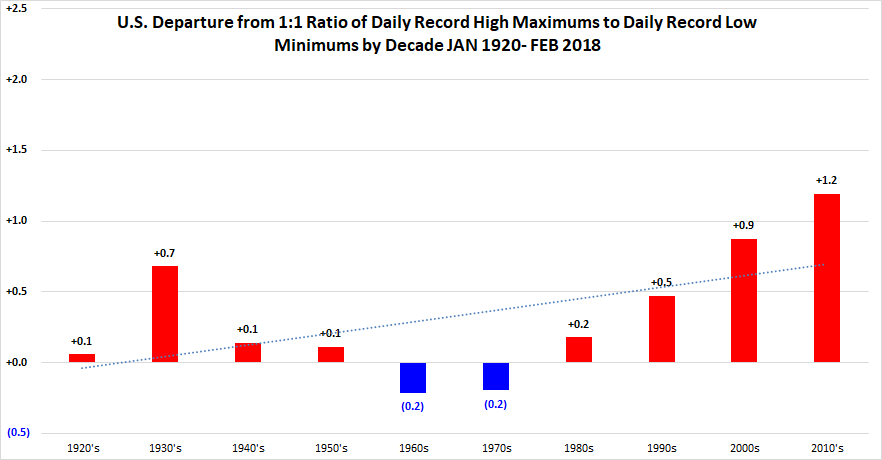
Here are the counts that make up this chart from: https://www.ncdc.noaa.gov/cdo-web/datatools/records
Before pressing on with the main point of this post I want to clear up the ground rules for these counts so their won’t be any misunderstandings. Each individual count could be a tied surface record or one broken by several degrees Fahrenheit. Also, for a station to be considered for any parameter, it must have a minimum of 30 years of data with more than 182 days complete each year. This is effectively a “30-year record of service” requirement, but allows for inclusion of some stations which routinely shut down during certain seasons. Small station moves, such as a move from one property to an adjacent property, may occur within a station history. However, larger moves, such as a station moving from downtown to the city airport, generally result in the commissioning of a new station identifier. This tool treats each of these histories as a different station. In this way, it does not “thread” the separate histories into one record for a city.
The NCEI tool provides simplistic counts of records to provide insight into recent climate behavior, but is not a definitive way to identify trends in the number of records set over time. This is particularly true outside the United States, where the number of records may be strongly influenced by station density from country to country and from year to year. These data are raw and have not been assessed for the effects of changing station instrumentation and time of observation. The main problem I find with https://www.ncdc.noaa.gov/cdo-web/datatools/records is that there is no easy way to glean counts from say stations with the same period of record (POR) without doing a lot of cherry picking…a task way to arduous for one single person. That stated what the NCEI tool does do well is show rough trends.
Think about this. In a warming world we would see fewer record lows as years go by. Statistically it would also be harder to achieve a record high, but those would be easier to be set as the climate gets warmer. For example let’s say that the record high for station X is 100F set on 6/1/15. The following year the record is broken by 1 degree (and gets a tally of 1 in my stats). On 6/1/17 station X reaches 100F again. Since the record high for station X is now 101F we do not get a tally from 6/1/17 even though it got just as hot as in 2015. However on 6/1/18 the thermometer at station X since the climate is warming reaches 101F again (a tied record, thus we get another tally). So in the last four years we get three points for the warm team from station X.
Now let’s say that in winter on 2/1/15 station X set a record low of 10F. The following year the thermometer at station X gets down to 9F setting a new record low (another tally for the cold team). On 2/1/17 station X has another minimum of 10F (so no points for the cold team since the record is now missed by 1 degree). Due to a warming climate after another synoptically cold pattern hits, the thermometer of station X on 2/1/18 only gets down to 12F (so no points for the cold tem again). Final score from statin X after four years: warm team 3/ cold team 2. So, this is how the record tally system works as a marker for climate change.
It makes sense looking at how tallies work that more would come from stations with longer PORs in the NCEI database. Let’s say, though, that many stations start producing tallies after being eligible with their start year being 1988 (just 30 years ago). Since we know the planet started to see a marked increase in average temperature during the 1980s far more record highs should come from these stations than lows. Since 1988 the same should hold true for stations with say PORs of 100 years except that these stations have experienced 70 more years of weather to set record highs and lows. The stations with PORs of 100 may not be setting any record lows since 1988 having established their long term record lows during a colder prior period of the 20th century. Both the stations with long and short PORs do contribute valuable trend record counts, though.
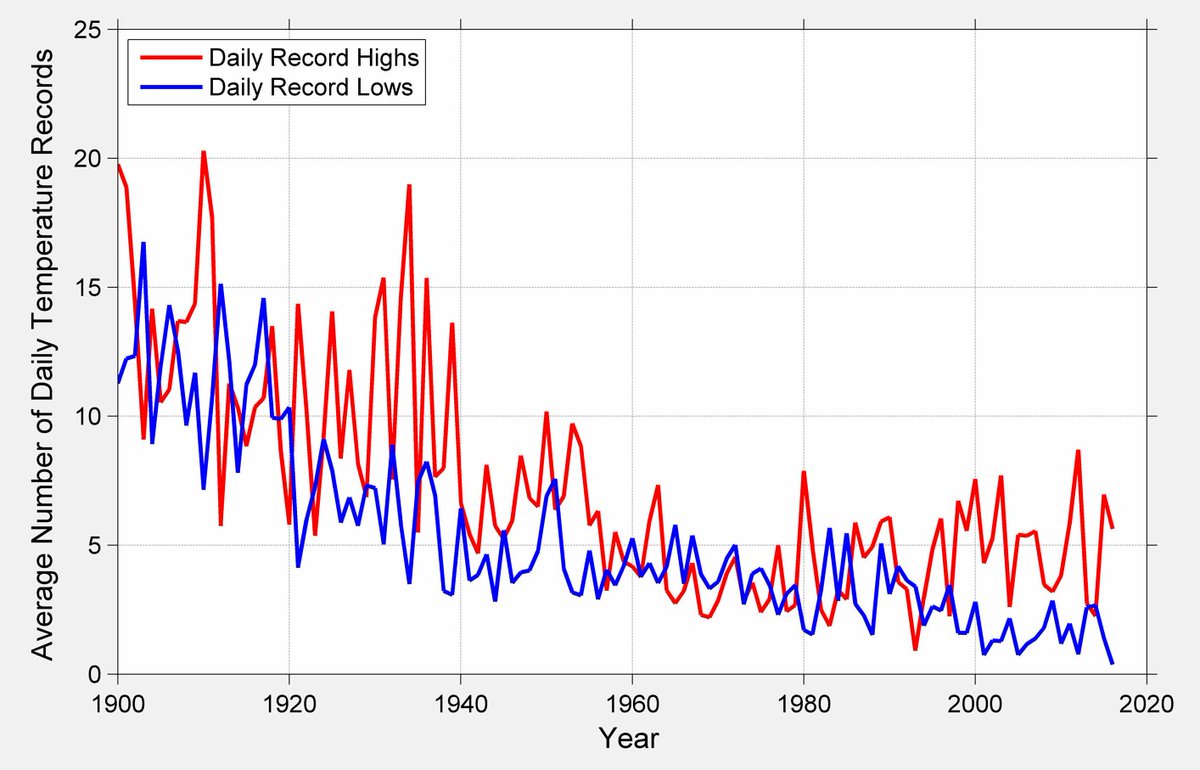
Indeed, those record low counts are diminishing faster than those for record highs:

Lastly, lets take a gander at my record scoreboard once more:
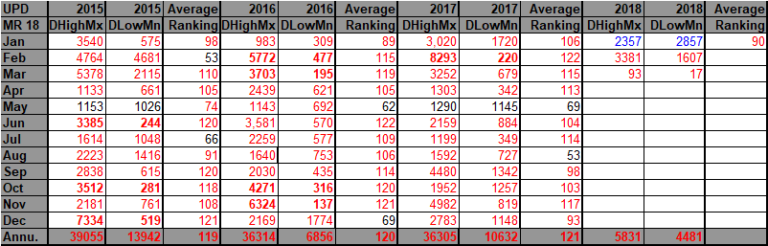
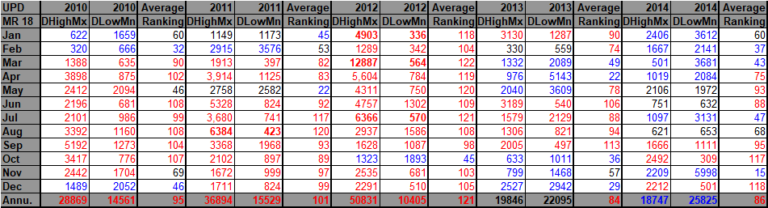
Notice that prior to 2015 many months during a year had tallies of record lows in excess of 1000. During the “spike warm” year 2016 only month, December, had a daily record low tally greater than 1000. Thus far this year we see two months of 1000+ record lows, but the overall “trend” predicted by the Meehl studies is getting more clear. The instances of record cold due to global warming are decreasing.
The Climate Guy