Friday March 16th… Dear Diary. The main purpose of this ongoing post will be to track United States extreme or record temperatures related to climate change. Any reports I see of ETs will be listed below the main topic of the day. I’ll refer to extreme or record temperatures as ETs (not extraterrestrials)😊. Here is today’s main climate change related topic: (If you like these posts and my work please contribute via the PayPal widget, which has recently been added to this site. Thanks in advance for any support.)
Global Averages Reaching a Nadir?
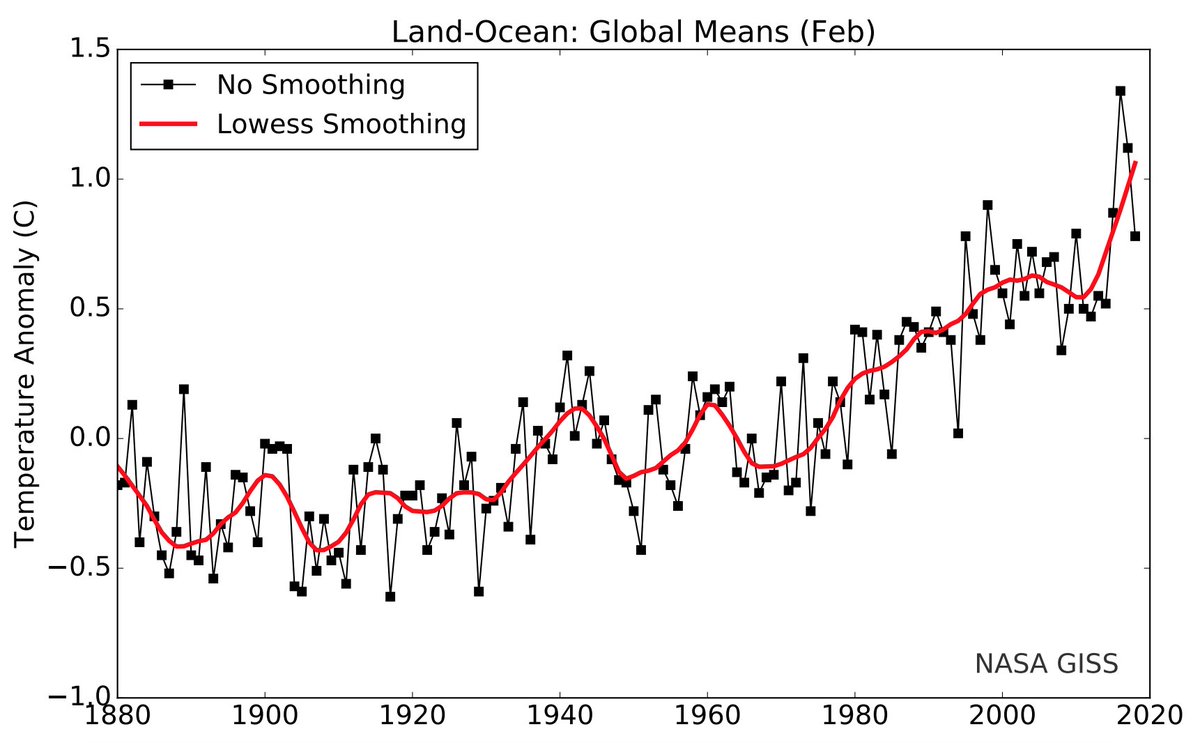
The Northern Hemisphere has seen more than its fair share of wintry, cold weather this season. I have dug through some NASA data showing a “short term downward trend” in global temperature averages. Don’t get me wrong. The overall global warming trend is such that each decade since the 1970s has been warmer than the last, so the 2010s should be the warmest decade since measurements began being taken. Nonetheless, during this warming trend we see peaks and valleys, or nadirs on average temperature charts from month to month and year to year. These nadirs via short term changes in sea surface temperatures and weather patterns are what some contrarians point to denying the potential severity of climate change. Looking at observations I’m wondering if we are seeing a nadir this year before subsequent warming, baring a big uptick in volcanic activity.
It’s a good thing to point out why these nadirs are occurring for counterargument purposes in any global warming debate. Also, as climatologists we need to delve into exactly what causes any “pauses” in global warming to make better long term forecasts. One of my first posts was on this subject:
https://guyonclimate.com/2017/01/26/climate-ebbs-and-flows/
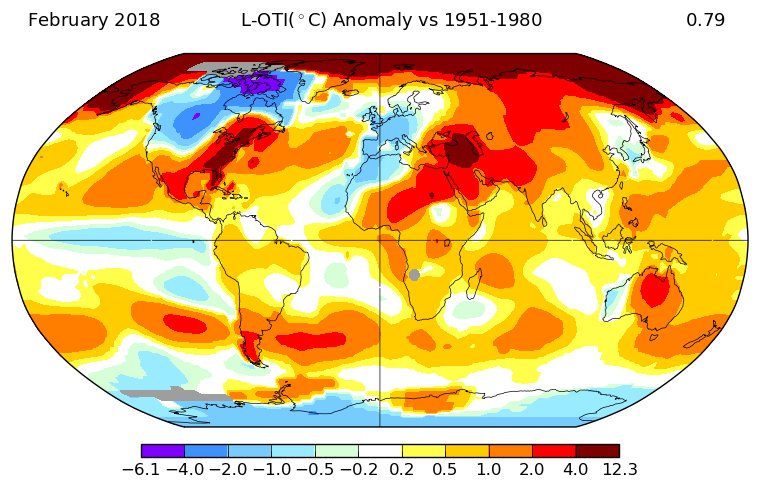
First, let’s look at this chart for February 2018 from NASA:
 NASA GISSVerified account @NASAGISS
 Zack LabeVerified account @ZLabe
[GISTEMP data/info: https://data.giss.nasa.gov/gistemp/news/20180315/ …]
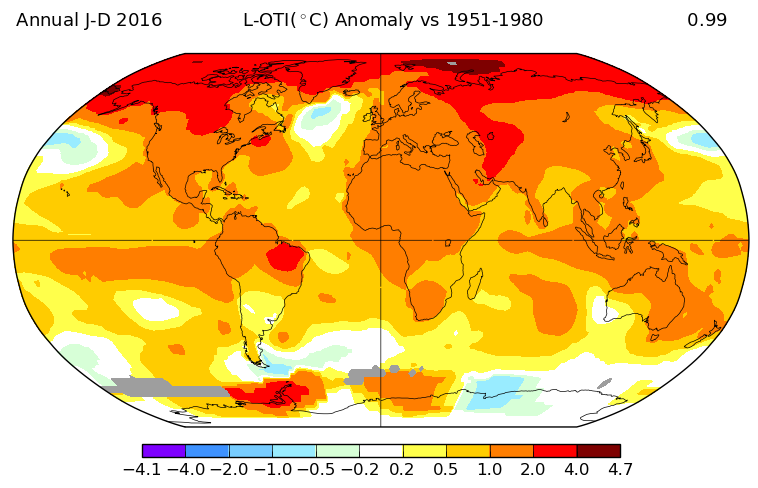
For 2016 I don’t see any significant cold pockets at all over and masses. Note the El Nino warmth west of South America. Now let’s look at 2017:
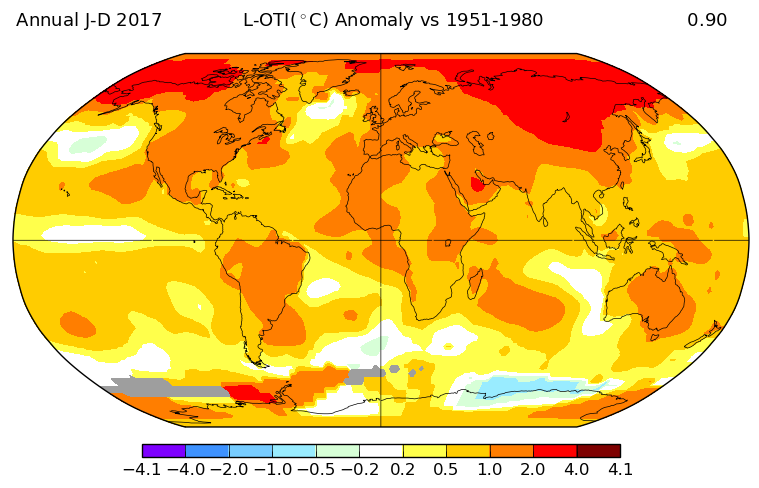
Not much has changed from 2016, except that the El Nino has been replaced by a La Nina driving global temperature averages down to 2nd warmest since 1880.
The 4th quarter of 2017 is quite interesting. On the following chart one can see the Arctic getting more anomalously warm, a few cold pockets beginning to form over Northern Hemisphere land masses, and that La Nina:
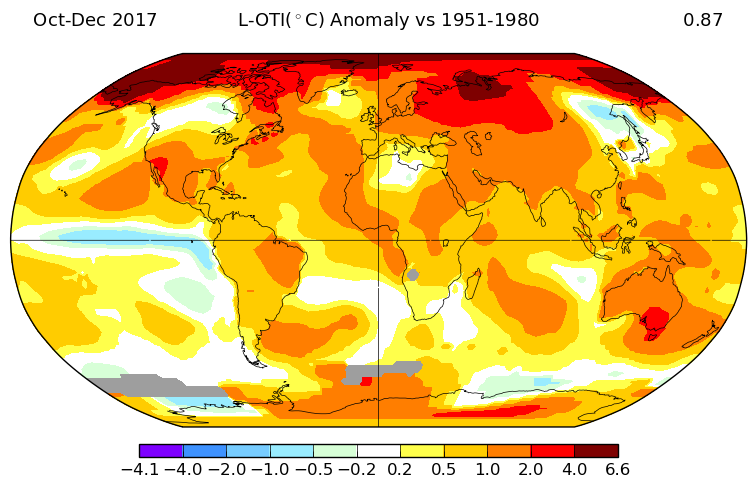
Of course, the water temperatures in the Pacific in association with ENSO get averaged in with the rest of the planet on both NASA and NOAA summaries. I expect that the current La Nina will end this spring or later this summer, so warmer Pacific averages should be part of global averages for 2018. What I will look for this year are more cold pockets developing south of a record warm Arctic that will drive down global averages below those of the last few years. Are these cold pockets related to La Nina or are they more in association with Arctic warmth buckling the jet, which we have delved into n prior posts this week?
This is a big question related to winter storms in general and those historic nor’easters. Here is a point. Once the planet resumes its warming trend we may not see as many cold pockets as this year, but that may be just educated speculation on my part. The planet will probably get a lot warmer once the next El Nino begins even if the Arctic gets a tad cooler. I’ll keep track of all anomalous warm and cold pocket regimes as we move through 2018.
…………………………………………………………………………………………………………………….
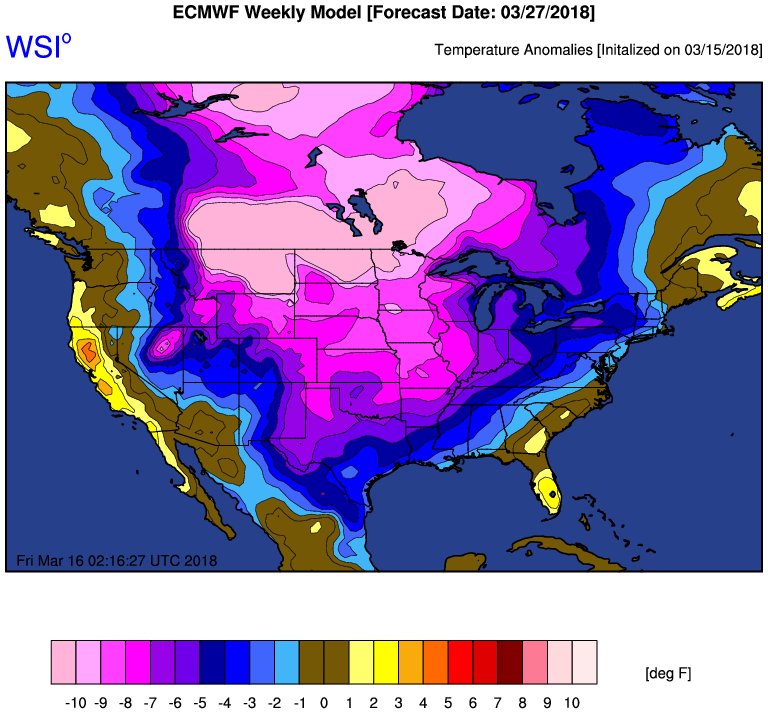
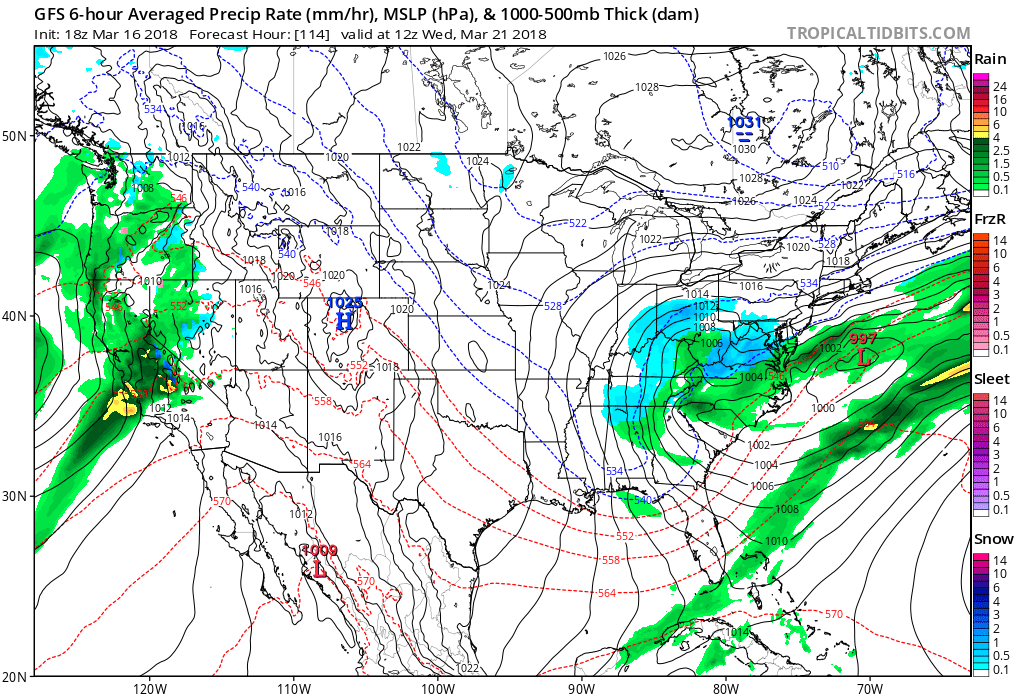
Speaking of cold pockets there should be a doozy over the eastern U.S. next week around the first official day of spring:

If this GFS model verifies I wouldn’t be surprised to se a few wet snowflakes flying as far south as Atlanta:
As far as “ETs” go we may get some points for the cold team from the Rockies through much of the East the last two weeks of March:
 Michael VentriceVerified account @MJVentrice