Saturday March 17th… Dear Diary. The main purpose of this ongoing post will be to track United States extreme or record temperatures related to climate change. Any reports I see of ETs will be listed below the main topic of the day. I’ll refer to extreme or record temperatures as ETs (not extraterrestrials)😊. Here is today’s main climate change related topic: (If you like these posts and my work please contribute via the PayPal widget, which has recently been added to this site. Thanks in advance for any support.)
Happy St. Patrick’s Day everyone!
Now that my NCEI record count since 1920 is complete I would invite anyone to use the posted archved data for research. Today I will try to partially answer a couple of questions. How rare are United States all-time and monthly records compared with the occurrence of daily record reports? More important, due to global warming how rare are all-time cold records becoming?
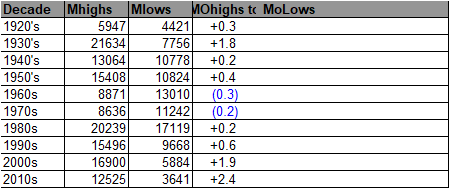
I’m going to use NCEI counts to try to answer these questions. The counts from JAN 1920 to FEB 2018 can be found under Categories in this site in the NCEI Record Count Archive. First, let’s pull the counts of daily, monthly, and all-time high maximum and low minimum (including tied) record temperatures:
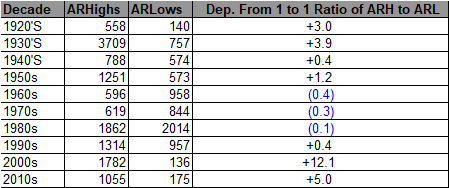
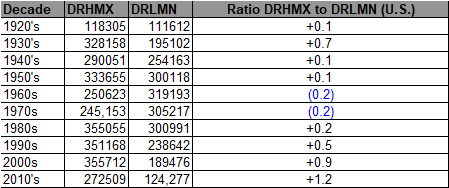
So far this decade we can see that the ratio of daily record maxes to all-time record maxes is 258.3 to 1, meaning that for every report of an all-time record maximum temperature there have been about 258 daily record maximums getting into the NCEI database: https://www.ncdc.noaa.gov/cdo-web/datatools/records So, we can get a picture of just how rare achieving an all-time maximum record is. There have been just 1,055 reports of ARHMX during the 2010s, but even more rare only 175 reports of ARLMN. Next let’s present another new chart combining the above grahics showing comparative ratios of all three datasets:
(Ratios of Monthly and Daily Counts to All-Time Counts)
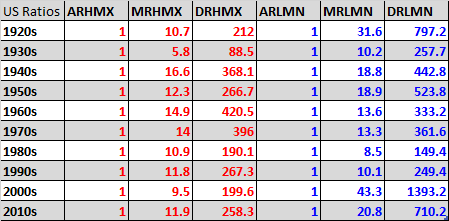
So what can we learn from this new chart? First, the ratio of MRHMX to ARHMX counts have remained about constant since the 1920s coming into the system at about a ratio of 10 to 1, but peaking at just under 15 to 1 during the colder decades of the 1960s and 1970s. Second, we see that during the colder decades of the 1960s and 1970s the ratio of DRHMX to ARHMX peaked at about 400 to 1. We would expect a higher ratio of DRHMX to ARHMX since it would be harder for weather to achieve extreme warm events during a colder climate.
For a warmer climate we would expect weather events to set more extreme warm records and less extreme cold records, so the ratio of MRLMN and DRLMN to ARLMN counts should go up (less record low minimum extreme records vs. more common daily low minimum records). Outside of the 1920s that is indeed what we are seeing for the first two decades of this century. The ratio of DRLMN to ARLMN counts is a whopping 1,393.2 to 1 for the 2000s. Indeed these statistics bear out that the climate is warming.
On a related interesting article that weather historian Chris Burt writing on Category Six of Weather Underground has posted this:
https://www.wunderground.com/cat6/extreme-short-duration-temperature-changes-us
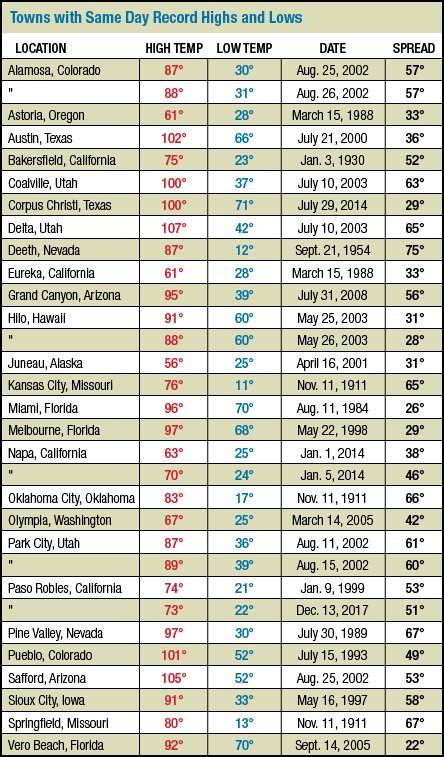
It’s actually possible for a station to set a daily record high and low on the same calendar day. Here is Chris’ list from his post:
(Towns and cities that have observed both their daily record high and daily record low on the same date):
Hopefully I’ve at least begun to answer the question’s on this post. I’ll add the same data for high minimum and low maximum counts tomorrow. If you have any question about these record count statistics drop me a line.
The Climate Guy