Wednesday June 6th… Dear Diary. The main purpose of this ongoing post will be to track United States extreme or record temperatures related to climate change. Any reports I see of ETs will be listed below the main topic of the day. I’ll refer to extreme or record temperatures as ETs (not extraterrestrials)😊. Here is today’s main climate change related hot topic:
NCEI Spring Climatology
The National Center for Environmental Information has crunched necessary numbers and completed their assessment for spring 2018. As expected May 2018 was the warmest May on record for the contiguous U.S. since rankings started in 1895 indeed breaking a log standing record set in 1934. As we have seen for most of the last two decades due to carbon pollution almost all seasonal averages end up above long term averages. Spring 2018 was yet another such occurrence despite a relatively chilly April. What raised my eyebrows was the astounding warm turnaround from April going into May, a signal that we have entered a new climate regime since the last strong El Nino in 2015 such that any synoptically produced cold patterns will rapidly be replaced by warmth in the future unless their is a big uptick in planetary volcanic activity, the only natural factor remaining that can temporarily cool Earth. For today’s post I will refer to this excellent NCEI article published this morning:
https://www.ncei.noaa.gov/news/national-climate-201805

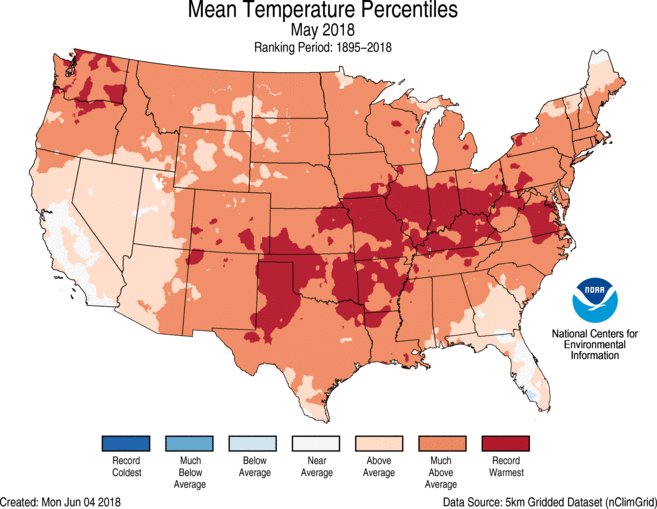
- Above-average May temperatures stretched from coast to coast with every state having an above-average temperature. Record warmth was observed in parts of the Northwest and stretching from the Southern Plains through the Midwest and into the Mid-Atlantic. Forty-two states had monthly temperatures that were much above average with eight of those states – Arkansas, Illinois, Indiana, Kentucky, Missouri, Ohio, Oklahoma and Virginia – being record warm.
- The nationally averaged minimum temperature (overnight lows) was exceptionally warm during May at 52.5°F, 5.1°F above average and 2.0°F warmer than the previous record set in 1987. Fourteen states had a May minimum temperature that was record warm with 29 additional states having much-above-average minimum temperatures.
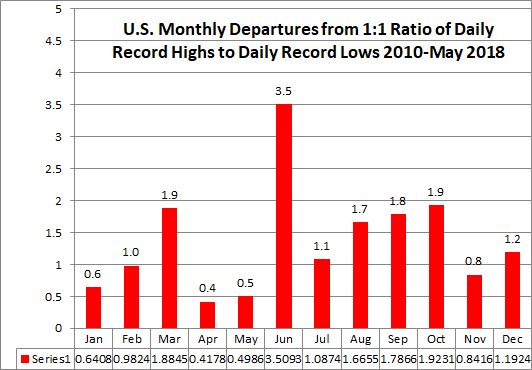
- On the daily scale, there were more than 8,590 daily warm temperature station records broken or tied during May. This was 18 times more than the approximately 460 daily cold temperature station records during the month. Several of the daily records were noteworthy, including 100°F on May 28 in Minneapolis, Minnesota – the earliest such occurrence on record.
I highlighted in red NCEI’s assessment of record counts, which I’ve been keeping tabs on since 1/1/2000. One could write that we were “way overdue” for a hot May looking at record temperature ratios and averages. May during the 2010s has had the lowest ratio than any other month. Here is my monthly bar chart before May 2018:

Now after:
Let’s take a look at the individual state ranking chart for May:


Quoting from the NCEI summary:
- Record and near-record precipitation was observed across the Southeast and Mid-Atlantic, partially due to two slow-moving weather systems, including subtropical storm Alberto in late May. Flooding and mudslides were widespread across the region, and Florida and Maryland each had their wettest May on record. On the station level, Asheville, North Carolina, the home of NCEI headquarters, observed its wettest month of any month on record, with 14.68 inches of rain. Several other locations, including Key West, Florida, had their wettest May on record. Above-average precipitation was also observed across parts of the West, Central Plains and Midwest.
- Below-average precipitation was observed along the West Coast, Southwest, Southern Plains, the Northeast and parts of the Midwest. The combination of warm and dry conditions contributed to ongoing drought concerns across these regions.
- After observing record-high spring snowpack across the interior Northwest and Northern Rockies, above-average May temperatures and precipitation caused rapid snowmelt, flooding rivers across the region. Flooding was observed in parts of Idaho, Montana, Washington and Wyoming.
As far as spring 2018 in totality goes we see more of the same climate change signatures:
Spring (March–May) Temperature

- Above-average temperatures were observed across parts of New England and from the West Coast to the Southern Plains. Four states in the Southwest and Southern Plains had one of their 10 warmest springs on record.
- Across much of the East, the warm May counterbalanced the cold April, resulting in a near-average spring temperature. In the Great Plains and Midwest, the temperature jump from April to May was stark. For example, Wisconsin had its coldest April on record, followed by its second warmest May, with a month-to-month temperature increase of 28.6°F.
Spring (March–May) Precipitation

- Above-average spring precipitation was observed across parts of the West and along parts of the East Coast. Below-average precipitation was observed for most of the central U.S., Southwest, and parts of the Northeast. Arizona and New Mexico each had their 10th driest spring on record. The warm and dry spring, particularly across parts of the Great Plains, could impact the upcoming growing season in agricultural regions.
We will wait and see if Europe as well saw it’s warmest May on record when global temperatures are assessed by the middle of June. G
………………………………………………………………………
Dear Diary. This evening it would appear that a low grade heat wave will continue into day 3 across most of Texas Thursday.Where the mercury will get well above 100 in drought plagued West Texas advisories are posted:
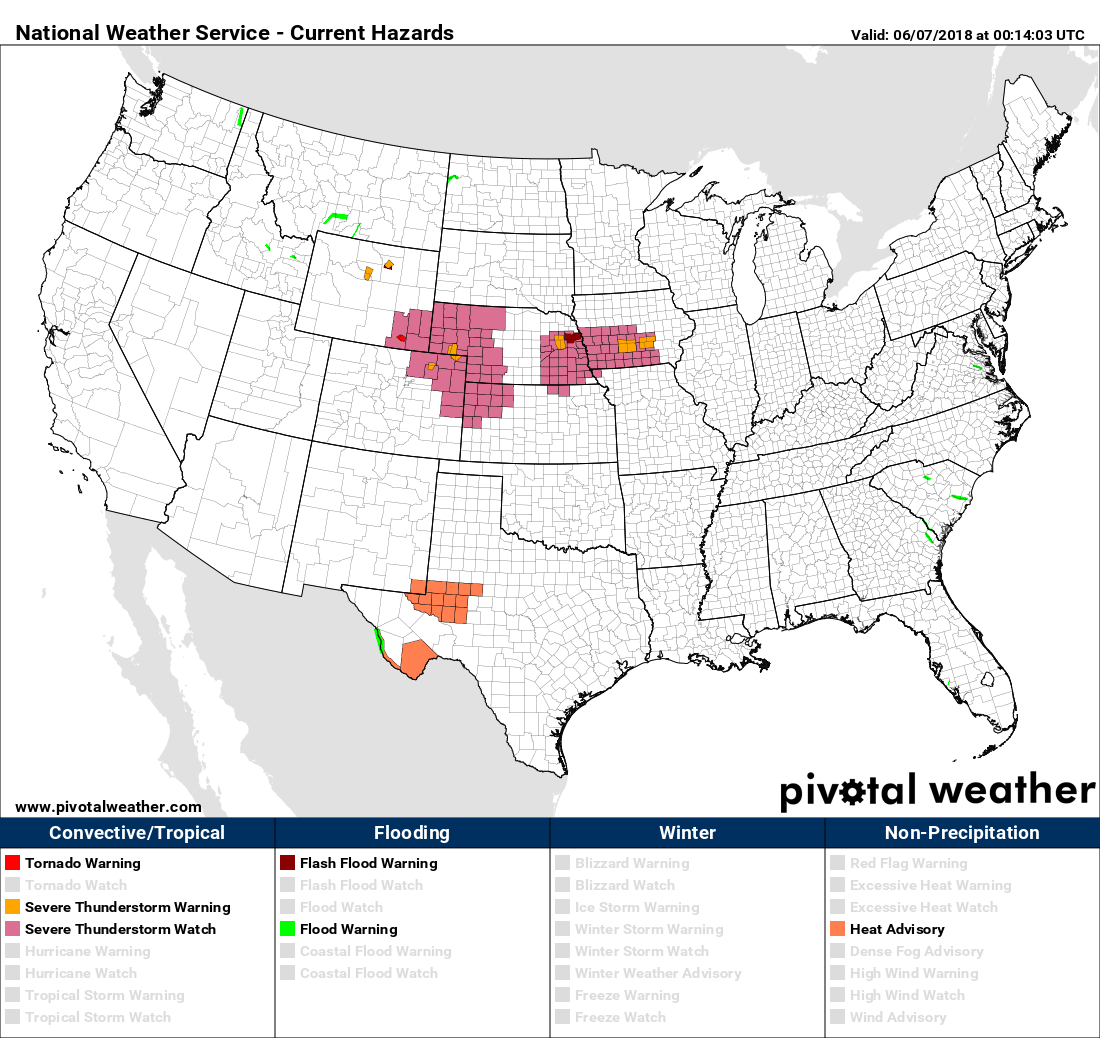
Looking at Thursday’s maxes people will have to take usual precautions for heat across the southern half of the country, which is fairly typical for early June, just a few degrees above average except at least ten degrees in West Texas:
(If you like these posts and my work please contribute via the PayPal widget, which has recently been added to this site. Thanks in advance for any support.)
The Climate Guy