Monday June 25th… Dear Diary. The main purpose of this ongoing post will be to track United States extreme or record temperatures related to climate change. Any reports I see of ETs will be listed below the main topic of the day. I’ll refer to extreme or record temperatures as ETs (not extraterrestrials)😊. Here is today’s main climate change post related hot topic:
A Warmer 2019
As most know I’m very interested in mathematical trends on graphs because minutia on charts can tell us something. Today I saw a very clear graphic from climate scientist Zake Labe showing the last two super El Ninos did to global temperature averages:
If you look at Zack’s chart closely there are no more than three blips or points representing individual years either in a positive warmer or negative cooler direction. Since the super El Nino of 2016 we see two blips in the negative cooler direction, that of 2017 and more than likely 2018 due to the affects on global ocean and atmospheric averages from La Nina. Usually after a strong El Nino the Pacific waters revert to La Nina, which temporarily cools the planet. Once the La Nina fades usually a period of neutral conditions occur, but the cooling effects from the La Nina lag in the atmosphere much like the warmest and coldest climatological months of the year lag a month in the future from the winter and summer solstice. We will probable see 2018 get labeled as a neutral ENSO year.
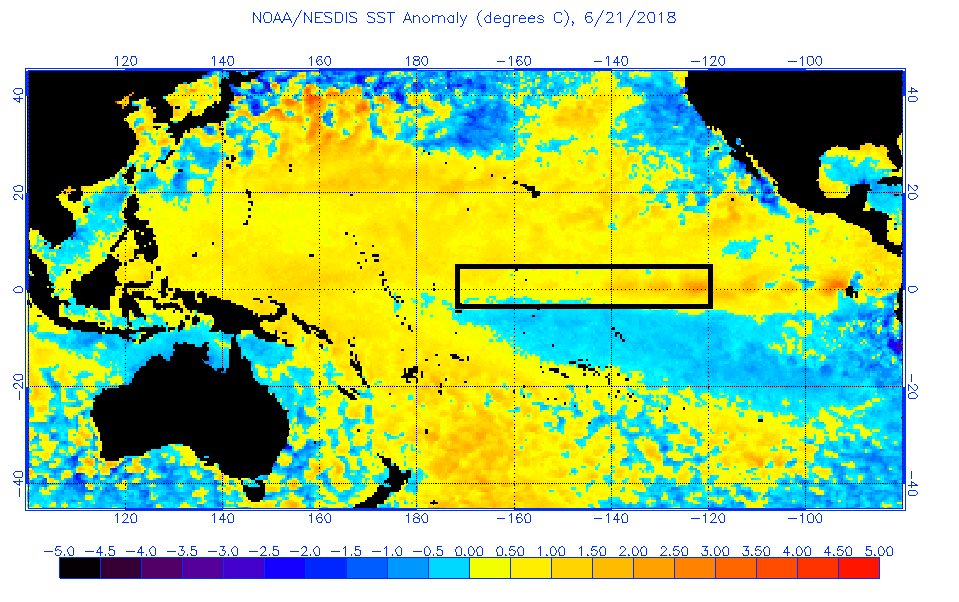
There are indications, though, that a new El Nino is in the works:
Should an El Nino start later this year lasting into much of 2019 heat from the episode will just add to the warming trend from carbon pollution both in the seas and air. This coming El Nino probably won’t be as strong as the 1997 and 2016 episodes, but more than likely will be warm enough to affect global temperature averages. If neutral conditions were to persist we may see global averages go flat, but I’m guessing that 2019 will be warmer than 2018 looking at trends unless their is a significant increase of volcanic activity. Keep in mind that these averages are increasing and decreasing by about .1C per year with the current average at about +1.1 C above preindustrial conditions.
Why is such minutia important? Because we have seen since about 1980 that a small increase in global averages has resulting in alarming decreases in polar ice, worse heat waves, drought, and flooding. Higher sea surface temperatures strengthen hurricanes. In a nutshell this is why the Paris Accords are an effort to keep global temperatures below +2.0C. In 2019 we will probably see a step in the wrong direction.
…………………………………………………………
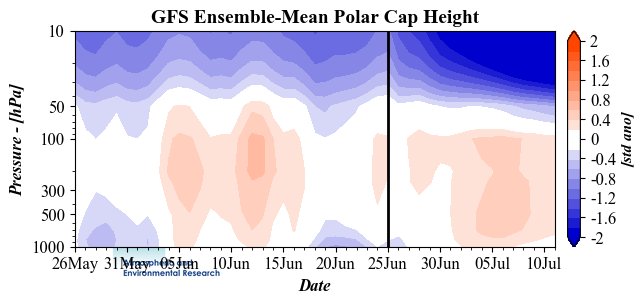
Yesterday on this site I wrote in detail about the potential for a long lasting heat wave across the Midwest and Northeast by July. There might be a glimmer of hope looking at 12Z Monday data any heat wave may get curtailed:
As far as tomorrow goes we will see increasing heat in the Southwest, central Plains and mid-Mississippi Valley, but in most cases values will be below record limits:
Here are today’s maxes:
On Monday heat was only marginal dangerous across the southern tier of states.
(If you like these posts and my work please contribute via the PayPal widget, which has recently been added to this site. Thanks in advance for any support.)
The Climate Guy
 Zack LabeVerified account @ZLabe
 Philip KlotzbachVerified account @philklotzbach