Friday April 19th… Dear Diary. The main purpose of this ongoing post will be to track United States extreme or record temperatures related to climate change. Any reports I see of ETs will be listed below the main topic of the day. I’ll refer to extreme or record temperatures as ETs (not extraterrestrials).😉
Warming By State Via Climate Central
This week Climate Central has issued another report showing how much global warming has influenced individual states within the United States since the first Earth Day in 1970, which will be today’s featured article and topic. Let’s check it out:
https://www.climatecentral.org/gallery/maps/us-warming-by-state

U.S. Warming By State
- Published: April 17th, 2019
By Climate Central
Earth Day is the largest civic observance in the world, with more than 1 billion engaged annually in environmental activities. As humanity’s carbon dioxide emissions continue to rise, pushing atmospheric concentrations to the highest level in at least two million years, climate change has become a key part of Earth Day awareness.
This year, a new Climate Central report highlights the fastest-warming cities and states since the first Earth Day — showing that global warming is here and now. Since Earth Day began in 1970, temperatures have risen in almost 98 percent of the 242 cities analyzed. Las Vegas leads the list with a 5.8°F increase, and nine other cities have warmed 4°F or more. As for states, temperatures have risen at least 1.8°F in all U.S. states measured, with a national average increase of 2.5°F. (Click on the widget to find an individual city’s data):
Alaska is the fastest-warming state by far, as the Arctic is warming twice as quickly as the rest of the world. And what happens in the Arctic, doesn’t stay in the Arctic. Melting glaciers are fueling sea level rise and permafrost thaws are releasing more heat-trapping gases. According to a recent UN report, winter temperatures over the Arctic Ocean could rise 5-9°F by midcentury unless the world’s emissions reduction commitments are strengthened. Alaska’s March was a foreboding sign, with temperatures a stunning 15.9°F above normal.
The Southwestern U.S. is another hotspot of warming: New Mexico and Arizona come next in our state rankings, and four Southwestern cities lead the table of cities below. The region is especially vulnerable to droughts and heat extremes — dangers that are expected to worsen with climate change.
Warming is the foundation for the wide range of climate impacts that we experience in communities around the world. It’s increasing the frequency and intensity of extreme weather, harming health, stressing food and water supplies, shifting seasons and ecosystems, rising sea levels, damaging infrastructure and economies, and threatening ways of life. Curbing these hazards may be the greatest challenge of our time, but mitigating solutions exist from renewable energy to cleaner transportation and agriculture. Talking about climate change can help, too.
Additional resources:
- Our new report: American Warming: How the U.S. Has Heated Up Since the First Earth Day
- Data for the complete rankings by state and city
- Our toolkits that explain extreme weather and climate change
- The Fourth National Climate Assessment, for climate impacts by region
- Earth Day activities to engage your audience
Methodology: Temperature change is based on a mathematical linear trend line derived from the annual average temperature. State and national data compiled from NCEI Climate at a Glance. Individual station data compiled from the Applied Climate Information System. Trends begin in 1970 for consistency between all stations in the analysis. Reno, Nevada was excluded from ranked tables because of data inconsistencies unique to that city’s weather station.
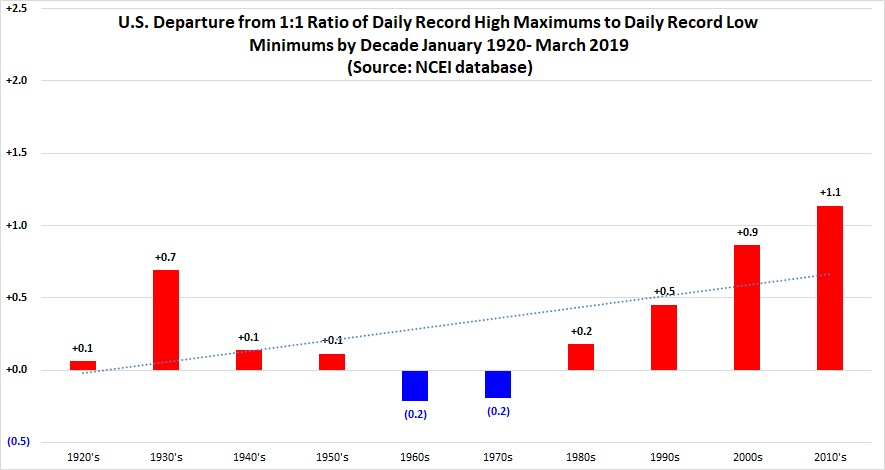
My own counts of NCEI record data indicate a warming trend, especially since 1970:
I’m sure that these warming trends will continue going into the 2020s baring a tremendous uptick in volcanic activity.
…………………………………………………………………………………………..
Here is some more climate and weather news from Friday:
(As usual, this will be a fluid post in which more information gets added during the day as it crosses my radar, crediting all who have put it on-line. Items will be archived on this site for posterity. In most instances click on the pictures of each tweet to see each article.)
(If you like these posts and my work please contribute via the PayPal widget, which has recently been added to this site. Thanks in advance for any support.)
Guy Walton- “The Climate Guy”
Waiting for more content like this.