Saturday October 19th… Dear Diary. The main purpose of this ongoing blog will be to track United States extreme or record temperatures related to climate change. Any reports I see of ETs will be listed below at the very end of this daily blog. I’ll refer to extreme or record temperatures as ETs (not extraterrestrials).😉
Looking Back At This Arctic Summer…A Summary
Have you ever dreaded getting back a report card knowing that you are failing one or multiple classes, being over your head, swamped with work trying to improve your grades? At this point many in this decade some in the public feel like they are failing all at the University of Climate.
On the flip side most climatologists feel deflated these days when state of climate reports are produced for their students, the public. Some feel like concerned but stern teachers wanting their students to learn life lessons from their classes. These teachers may very much dread grading midterms, knowing that some students are failing to do work necessary to learn. Such is the state of climate crisis reports being issued at the end of each season, month and year. Today we won’t discover that little Susie or Johnny is passing a class. On the contrary, climate contrarians and most of the public continue to not do their due diligence…and not change their behavior after failing some initial tests.
Well, here is the resulting score after another Arctic summer has gone in the books. After initial “tests” during the 1980s and 1990s this failing rate of change should have slowed due to a mass change in behavior and attitude. I’ll give you my grade after you read this summary:
Falling up: A look back at the 2019 Arctic summer – New record daily lows for sea ice extent in July and early August
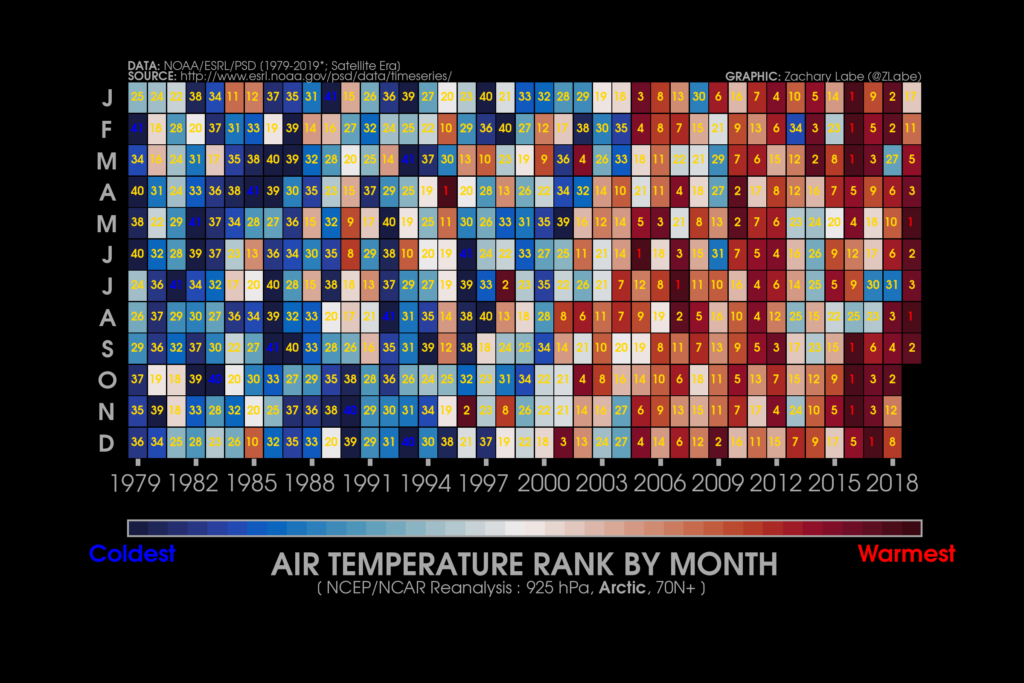
This graphic ranks months based on their Arctic air temperature from 1979 to 2019 at 925 hPa from the National Centers for Environmental Prediction/National Center for Atmospheric Research (NCEP/NCAR) Reanalysis for all areas north of 70 degrees N. Dark reds indicate warmest months; dark blues indicate coldest months. Graphic: Zachary Labe / University of California, Irvine
3 October 2019 (NSIDC) – Arctic sea ice began its autumn regrowth in the last 12 days of September, with the ice edge expanding along a broad front in the western Arctic Ocean. Overall, the summer of 2019 was exceptionally warm, with repeated pulses of very warm air from northern Siberia and the Bering Strait.
Arctic sea ice extent for September averaged 4.32 million square kilometers (1.67 million square miles), the third lowest in the 41-year continuous satellite record, behind 2012 and 2007. This is 750,000 square kilometers (290,000 square miles) above the record low set in September 2012, and 2.09 million square kilometers (807,000 square miles) below the 1981 to 2010 average. Following the minimum seasonal extent, which occurred on 18 September 2019 and tied for second lowest in the satellite record, rapid growth ensued along the ice edge in the northern Beaufort, Chukchi, East Siberian, and eastern Laptev Seas. Winds from the south caused a small area of continued ice retreat in the western Laptev and Kara Seas, offsetting some of the ice expansion. There was also growth in the Canadian Archipelago and offshore northwest of Greenland, with some expansion caused by drift to the northeast of Greenland. The Northern Sea Route appeared to still be open at the end of September.
This animation shows Arctic sea ice decline from 1979 to 2019 from pink to purple, with dark purple in 2019. This animation is based on the Chartic Interactive Sea Ice Graph. Graphic: M. Scott / NSIDC
Conditions in context
Warm conditions marked September over the entire Arctic Ocean and its surrounding lands. Air temperatures at the 925 millibar level (about 2,500 feet above sea level) for the month were 2 to 4 degrees Celsius (4 to 7 degrees Fahrenheit) above the 1981 to 2010 reference period over the ocean region, reaching 4 degrees Celsius (7 degrees Fahrenheit) above average over the Beaufort Sea north of Alaska (Figure 2b). The surrounding Eurasian high-latitude areas experienced temperatures 1 to 2 degrees Celsius (2 to 4 degrees Fahrenheit) above the reference period average. Northern Canada and Alaska were also warm, at 1 to 4 degrees Celsius (2 to 7 degrees Fahrenheit) above average, with very warm conditions over the Yukon and eastern Alaska, which experienced temperatures 4 degrees Celsius (7 degrees Fahrenheit) above average. Only southern Greenland experienced below-average temperatures, around 1 degree Celsius (2 degrees Fahrenheit) below the 1981 to 2010 period. […]
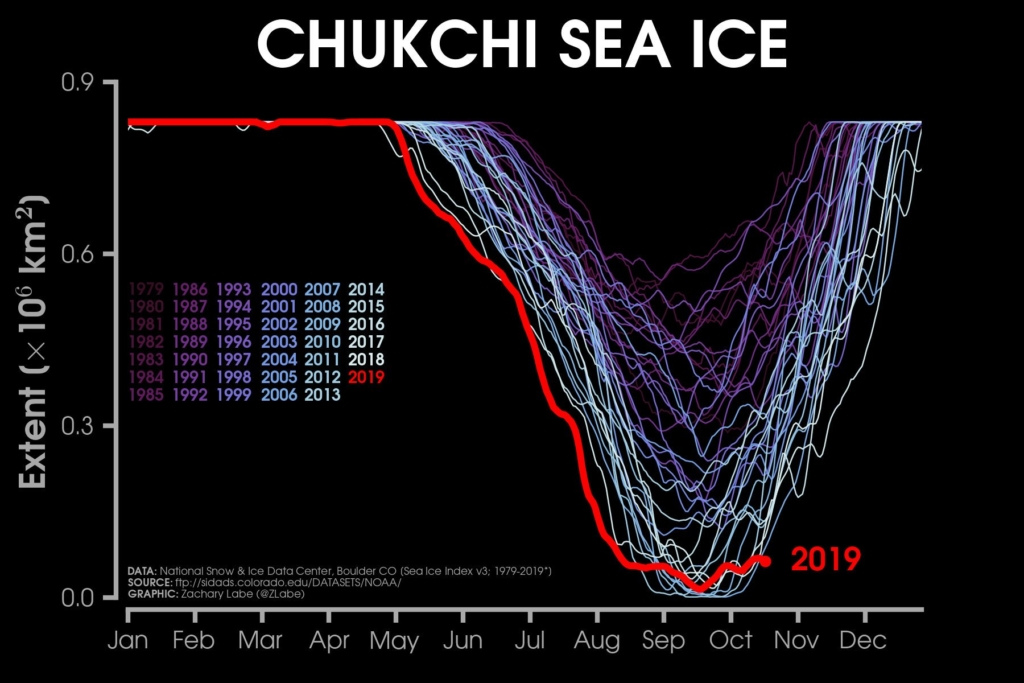
Sea ice extent in the Chukchi Sea, 1979-2019. Data for 2019 are through 19 October 2019. Graphic: Zachary Labe
A look back at the 2019 Arctic summer
Warm conditions across the Arctic Ocean, and early retreat of ice in the Chukchi and Beaufort Seas were distinguishing characteristics of the 2019 summer melt season, which followed another winter and spring with very little ice in the Bering Sea. Monthly average temperatures for the high Arctic (north of 70 degrees North latitude) show that the 2019 spring and summer months, from April to September, all ranked within the three warmest since 1979 (Figure 4a). Air temperatures at the 925hPa level over the Arctic Ocean for the period of June, July, and August were as much as 3 to 4 degrees Celsius (5 to 7 degrees Fahrenheit) above the 1981 to 2010 reference period average (Figure 4b). Similarly, warm conditions extended into central Siberia and southern Alaska. […]
The rate of sea ice decline in 2019 tracked the 2012 rate of decline for much of the summer, resulting in new record daily extent lows in July and early August for 2019. [more]
Well, little Johnny and Suzie deserve F’s obviously. I’m afraid that due to some initial failures back in the 1980s and 1990s it will be very hard for Jonny and Suzie to get a passing grade on climate during the mid part of this century, but not impossible. Obviously these climate report cards, such as that for the Arctic in 2019, work such that grades are passed down to subsequent generations. Would you want to receive an F in math because your dad or mother failed a course decades ago? Would your parents want to fail their kids, passing down to them an F in English they made years ago? Of course not, but unlike regular schools this is the way the climate university works. Let’s all keep learning and changing our behavior so that we won’t pass along any grades worse than a C when these Arctic reports come back during our children’s and grandchildren’s lifetimes.
Here is more from the Arctic:
Here is more climate and weather news from Saturday:
(As usual, this will be a fluid post in which more information gets added during the day as it crosses my radar, crediting all who have put it on-line. Items will be archived on this site for posterity. In most instances click on the pictures of each tweet to see each article.)
(If you like these posts and my work please contribute via the PayPal widget, which has recently been added to this site. Thanks in advance for any support.)
Guy Walton- “The Climate Guy”