Wednesday May 6th… Dear Diary. The main purpose of this ongoing blog will be to track United States extreme or record temperatures related to climate change. Any reports I see of ETs will be listed below the main topic of the day. I’ll refer to extreme or record temperatures as ETs (not extraterrestrials).😉
Main Topic: Early May Record Scoreboard Update and Climatological Review
Dear Diary. Repeating from April: As COVID-19 ravages the United States and the globe, climate change continues to be a simmering issue, which most news sources have put on the back burner of coverage because of the pandemic. On this site, though, the climate crisis will always make headlines, because it will be with us long after this pandemic abates.
Finally this year we saw a month of more record cold reports than warm, but April was a near average month based on long term temperature averages.
Here on this site we present monthly summaries near the 6th of each month, and each is available if you want to go back through my Extreme Temperature Diary archive.
I’m repeating my mantra from last month:
April 2020 got ranked by the National Center for Environmental Information as a near average April, temperature wise, for the lower 48 states, coming in as 73rd warmest or 54th coldest since records began being kept in 1895:
https://www.ncdc.noaa.gov/cag/national/rankings/110/tavg/202004
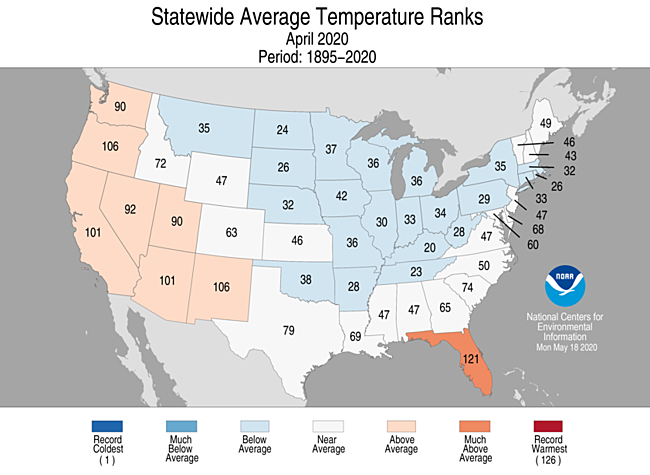
Like in March, Florida had the warmest averages relative to normal. The Midwest had the most anomalous chill while the West had the most warmth.
Here are my two U.S. Daily Record Scoreboards updated through 4/8/2020 (data compiled from the following NCEI site):
https://www.ncdc.noaa.gov/cdo-web/datatools/records
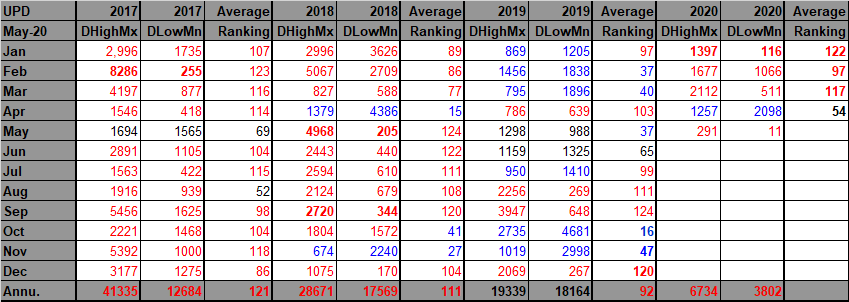
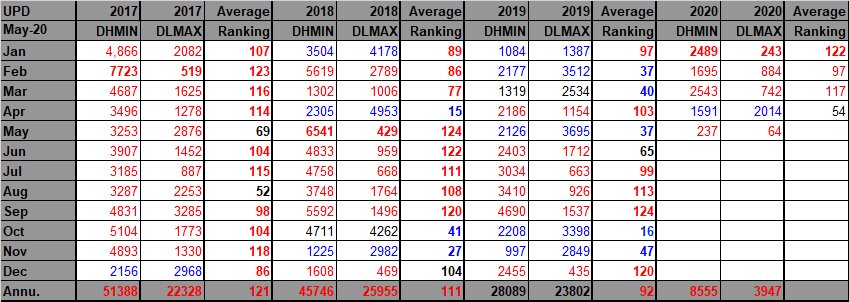
DHMX= Daily High Max Reports. DLMN= Daily Low Min Reports. DHMN= Daily High Min Reports. DLMX=Daily Low Max Reports.
For these data sets all monthly ratios of > 10 to 1 DHMX to DLMN or > 10 to 1 DLMN to DHMX are in bold type. The rankings are for the lower 48 states with the warmest ranking since 1895 of average temperatures being 125 and 1 being the coldest as of 2020. Blue colors represent cold months and red warm. Those months and years with counts close to a 1 to 1 ratio of highs to lows are colored black. Boldly colored months, such as January 2020, have ratios of more than 10 to 1 daily record highs to lows or lows to highs, and are either historically hot or cold, most of which have made news.
April 2020 had approximately a 3-5 ratio of record DHMX to DLMN individual record counts, so the color I used for this month was blue on the top chart.
April 2020 had approximately a 3-4 ratio of record DHMN to DLMX individual record counts, so the color I used for this month was blue on the bottom chart.
Due to climate change we will see less blue colors on these Record Scoreboards with time, but in the United States April 2020 was an exception.
We do have a hint, as indicated by red colors and ratios so far, that May 2020 could turn out warmer than average, but this time around early trends will be quite deceiving. As discussed on this blog over the last week there will be a big weather pattern change, which is also noted by the “Weather Professor:”
I expect as many as 6,000 combined record minimum and low maximum reports coming into the NCEI system before all is said and done from our May cold outbreak. We should see about 500-1000 record warm reports due to a ridge along the West coast for the same period, so overall May should clock in below average. Check in next month to see if this forecast verifies.
As stated, the ranking for March 2020 was 54, which was colored black. I color rankings +10 or -10 from the average ranking of 63 black, indicating that these are near average temperature wise.
Here is much more detailed U.S. climatology as complied by NOAA:
https://www.ncei.noaa.gov/news/national-climate-202004
Assessing the U.S. Climate in April 2020
Near-average April across the contiguous U.S. for temperature and precipitation

Courtesy of Pixabay.com
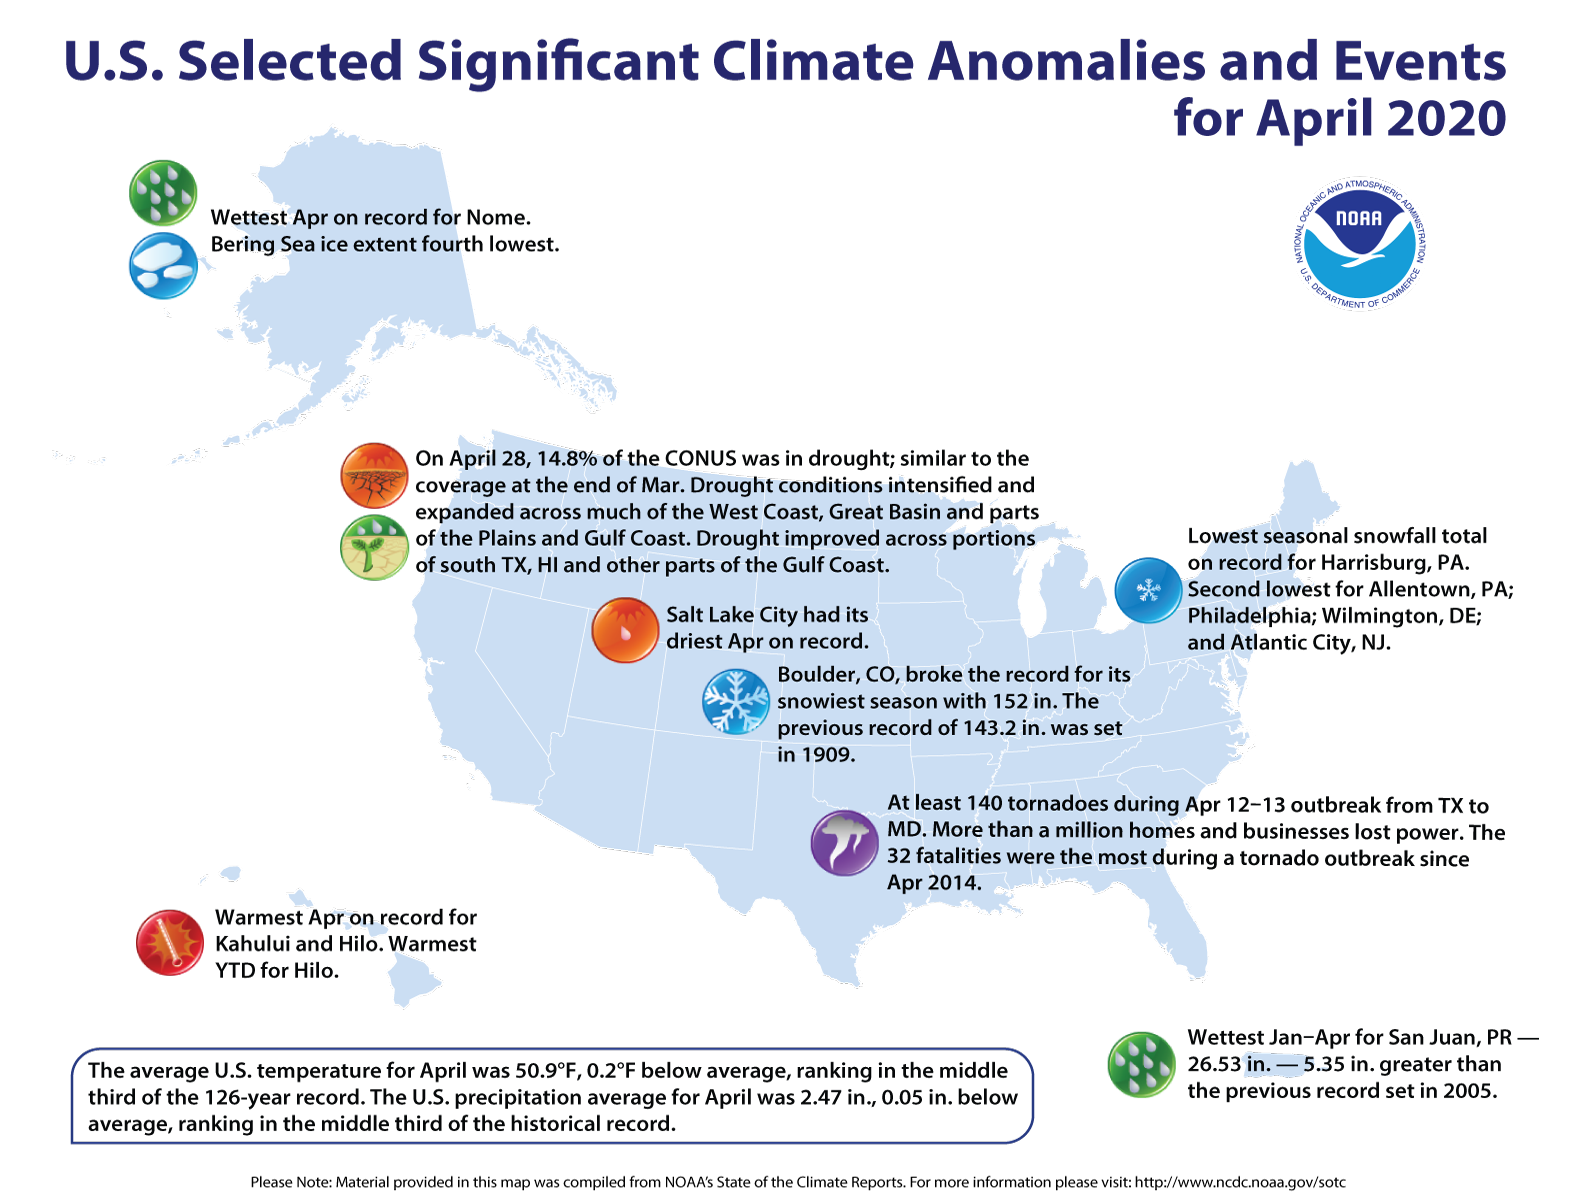
The most notable event during the month was an outbreak of at least 140 tornadoes from Texas to Maryland mid-month — the deadliest such event since 2014.
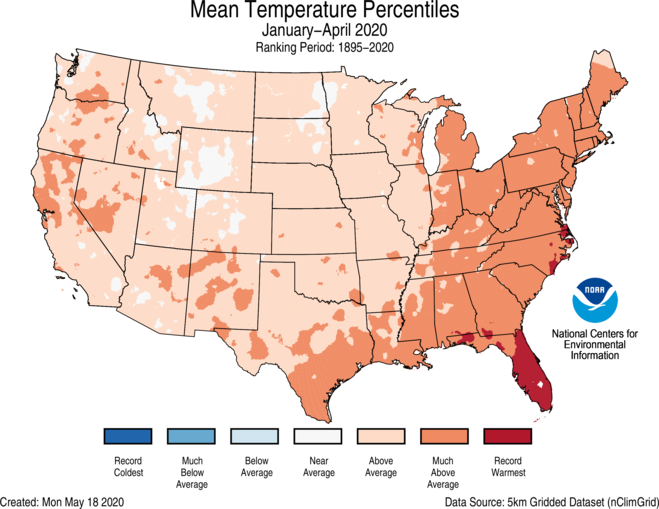
During April, the average contiguous U.S. temperature was 50.9°F, 0.2°F below the 20th-century average. This ranked in the middle third of the 126-year period of record. The year-to-date (January-April) average contiguous U.S. temperature was 42.2°F, 3.0°F above average, ranking 10th warmest on record. The April precipitation total for the contiguous U.S. was 2.47 inches, 0.05 inch below average, and ranked in the middle third of the 126-year period of record. The year-to-date precipitation total was 10.53 inches, 1.06 inch above average and ranked in the wettest third of the January-April record.
This monthly summary from NOAA National Centers for Environmental Information is part of the suite of climate services NOAA provides to government, business, academia and the public to support informed decision-making.
April Temperature
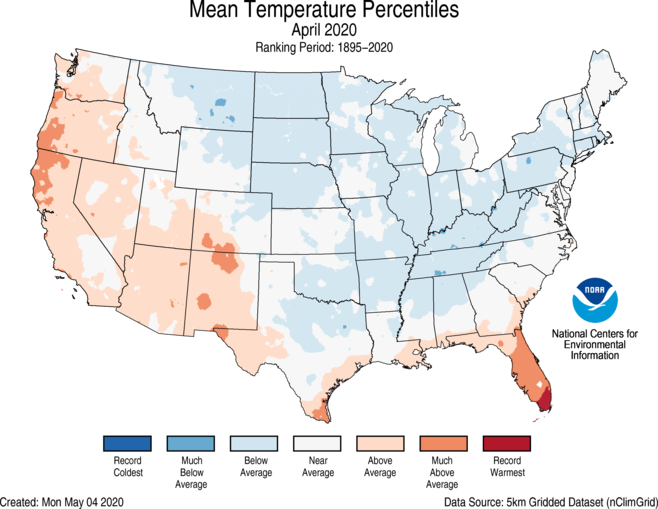
- Above-average temperatures were observed across much of the West Coast and Southwest as well as portions of the Gulf Coast and Florida. Florida ranked sixth warmest on record for April.
- Miami experienced its warmest April on record with an average temperature of 81.9°F. The previous record was 80.4°F set in 2015. In fact, April 2020 was warm enough to rank fifth warmest among all average temperature values on record for May.
- A large portion of the contiguous U.S., from the northern Rockies to the Great Lakes and from the southern Plains to the Northeast, experienced below-average temperatures.
- The Alaska April temperature was 27.5°F, 4.2°F above the long-term average. This ranked in the warmest third of the 96-year period of record for the state. On average, the North Slope, West Coast, Bristol Bay and Aleutian divisions had temperatures that were much-above average, while the southeast mainland and Panhandle regions were near to below average for the month.
- Utqiaġvik reported a record low temperature of −20°F on April 29. This is the first record low temperature reported at this station since December 21, 2007, and is the latest in the season with a low temperature of −20°F or colder.
- Bering Sea ice cover for April was greater than the extent observed in both 2018 and 2019, but was still fourth lowest on record.
April Precipitation

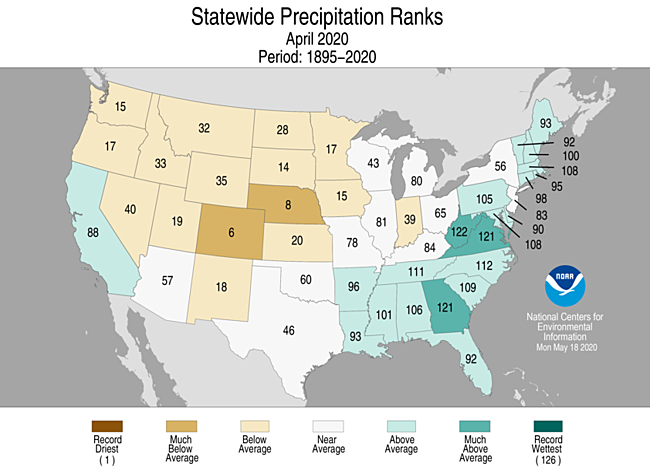
- Above-average precipitation was observed across parts of the West, lower Mississippi Valley, Great Lakes, Southeast, Mid-Atlantic and New England. West Virginia ranked fifth wettest while Virginia and Georgia ranked sixth wettest April on record.
- With 16.9 inches of snowfall reported on April 16, Boulder broke the record for its snowiest season. For the season and through the end of April, Boulder received 152 inches of snow, surpassing the record of 143.2 inches set in 1909.
- Rapid City, South Dakota, had its second snowiest season on record in 2019-2020 with 86.9 inches of snow. The record of 90.2 inches occurred during the snow season of 2008-2009. The third snowiest season occurred a year ago during 2018-2019.
- Below-average precipitation was observed from the Pacific Northwest to the western Great Lakes and from the Southwest through central Texas to the Canadian border. Nebraska and Colorado ranked sixth driest for April while Washington state ranked 13th driest.
- Salt Lake City had its driest April on record with 0.26 inch for the month, breaking the previous record of 0.45 inch set back in 1981 and 1934.
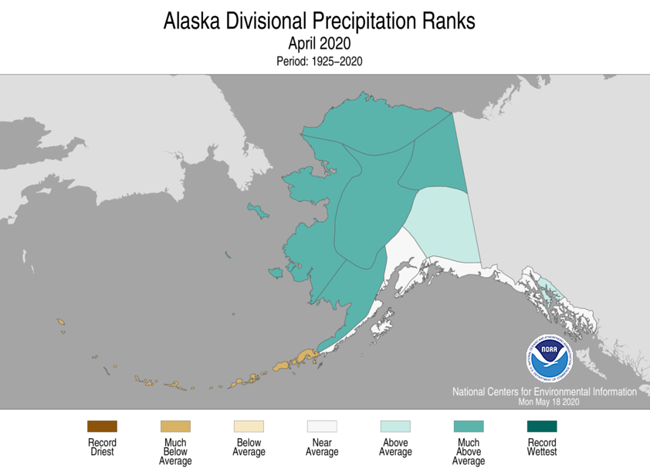
- April is climatologically either the driest or second driest month of the year across Alaska. Precipitation received during April 2020 was three to five times the average value in many locations and ranked in the wettest one-third of the historical record for the state. For some interior locations, this exacerbated an already above-average snow pack season.
- Nome received a record 2.47 inches of precipitation for the month of April, breaking the previous record of 2.15 inches set in 1961.
- Nome had its wettest March-April on record and Fairbanks its second wettest.
- Snowpack was at or near record levels at some locations from the upper Kuskokwim River to the Alaska Range. This helped raise water levels on some of the largest Alaskan rivers.
- According to the April 28 U.S. Drought Monitor report, 14.8 percent of the contiguous U.S. was in drought, up slightly from 14.5 percent at the end of March. Drought conditions intensified and expanded across much of the West Coast, Great Basin and parts of the Plains and Gulf Coast. Drought improved across portions of south Texas, Hawaii, and other parts of the Gulf Coast.
April Extremes
- A notable ridge of high pressure in the Gulf of Alaska mid-month contributed to the large trough of low pressure over the Central U.S. This was accompanied by a big cold-air outbreak across the central Plains.
- On the leading edge of the trough was a strong cold front, which brought significant precipitation across much of the Southeast and was accompanied by severe weather, including the Easter Sunday/Monday tornado outbreak on April 12–13.
- Based on preliminary surveys and analysis, 140 tornadoes have been confirmed from Texas to Maryland: 3 EF4s, 12 EF3s, 20 EF2s, 77 EF1s and 28 EF0s.
- More than a million homes and businesses lost power. With 32 tornado-related fatalities reported, this was the deadliest tornado outbreak since April 27–30, 2014.
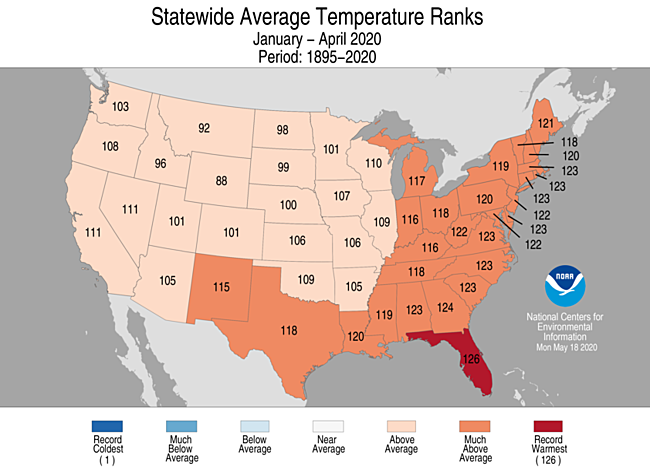
Year-to-date (January-April) Temperature

- Above-average to record-warm temperatures blanketed most of the Lower 48. Florida ranked warmest on record for the first four months of the year with 12 additional states from the Deep South to New England experiencing a top-five warmest January-April period.
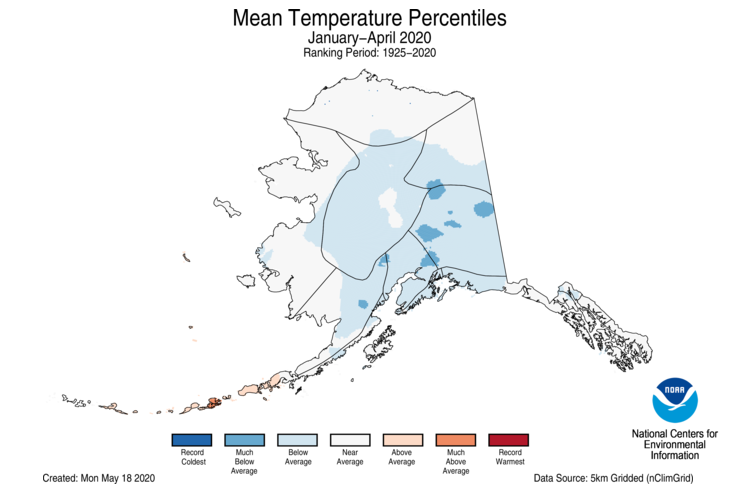
- The Alaska January-April temperature was 8.7°F, 1.6°F below the long-term average and ranked in the coldest one-third of the record. Below-average temperatures blanketed an area from the Central Interior to the Northeast Gulf and westward into the Bristol Bay division. A small portion of the Aleutians ranked above average during this time.
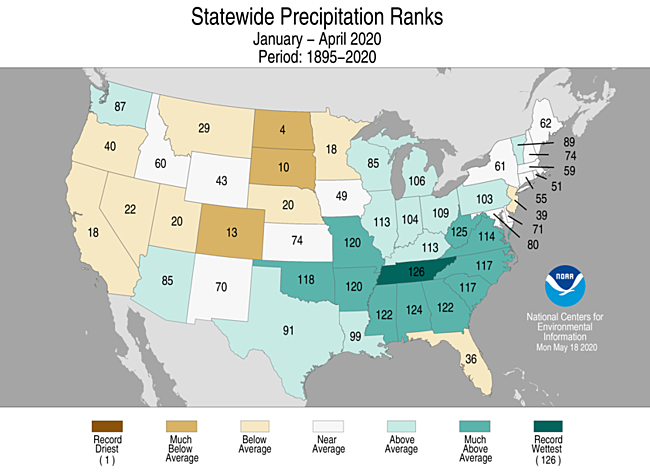
Year-to-date (January-April) Precipitation
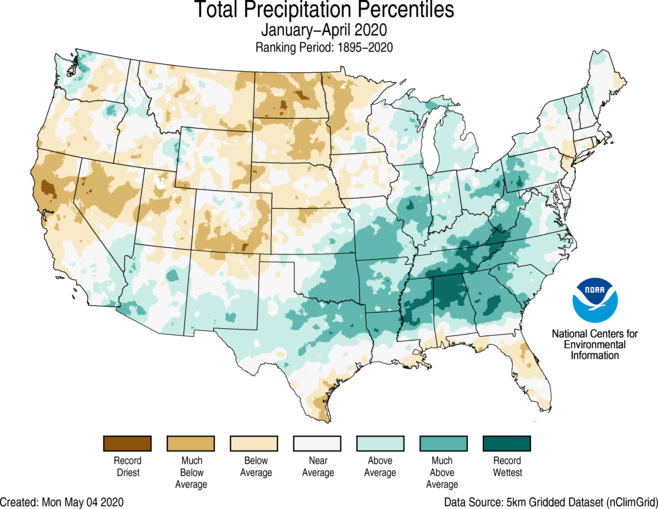
- Above-average precipitation stretched from parts of the Southwest to the Southeast and from the Tennessee Valley to the Great Lakes and into portions of the Northeast. Tennessee ranked wettest for this four-month period while West Virginia and Alabama ranked second and third wettest on record, respectively.
- Below-average precipitation was observed from the West Coast, across the central Rockies and into the northern Plains as well as across portions of the Gulf Coast and Florida. North Dakota ranked fourth driest for the first four months of the year, while South Dakota ranked 10th driest.
- Harrisburg, Pennsylvania, reported its lowest seasonal snowfall total on record — second lowest for Philadelphia and Allentown, Pennsylvania; Wilmington, Delaware; and Atlantic City, New Jersey.
- San Juan, Puerto Rico, received above-average precipitation again in April. The airport received a total of 26.53 inches of precipitation for the period January-April — the wettest such period on record and 5.35 inches greater than the previous record set in 2005.
- The (March-April) snowfall total for Fairbanks, Alaska, through April 30, is 35.4 inches. This is more than four times the average amount and ties with 1963 as the third highest spring total on record. The current March-April record is held by 1918 with 40 inches of snow.
……………………………………………………………………………………………….
Now here are some of today’s articles and notes on the horrid COVID-19 pandemic. (As usual, the most noteworthy items will be listed first.):
Here is more climate and weather news from Wednesday:
(As usual, this will be a fluid post in which more information gets added during the day as it crosses my radar, crediting all who have put it on-line. Items will be archived on this site for posterity. In most instances click on the pictures of each tweet to see each article. The most noteworthy items will be listed first.)
Here is today’s big “ET:”
(If you like these posts and my work please contribute via the PayPal widget, which has recently been added to this site. Thanks in advance for any support.)
Guy Walton “The Climate Guy”