Wednesday June 10h… Dear Diary. The main purpose of this ongoing blog will be to track United States extreme or record temperatures related to climate change. Any reports I see of ETs will be listed below the main topic of the day. I’ll refer to extreme or record temperatures as ETs (not extraterrestrials).😉
Main Topic: Summer 2020 Climate Lottery Contest
Dear Diary. It’s time for all of my friends to play the Summer 2020 Climate Lottery Contest for fun an educational purposes. This post will also serve as a repository for basic U.S. climatological information from the prior season.
The Climate Lottery is a forecast contest free to play by giving your picks in an e-mail or in this post’s comment section. No prizes will be given out for the contest, which is for educational purposes only. The main purpose for the contest is to make people interested in National Center for Environmental Information climate products. The special account that I have set up for the contest is guywalton10@gmail.com. This time I will make a personal pick, following along with any players.
The National Center for Environmental Information ranking numbers for average temperatures of the lower 48 states for Summer 2020 will be posted on or shortly after September 6th, 2020 which will be the official “Climate Lottery” numbers of the contest. Any subsequent changes by NCEI after their initial posted rankings will not be valid for the contest…but those ranking numbers will change with time.
The winning Climate Lottery numbers for Spring 2020 (MAR, APR, MAY) were 117/54/77 with a Power Ball number of 107 for the season, meaning that the Spring 2020 was 20th warmest in recorded history for the U.S.
Hello again to all weather and climate geeks out there. Spring 2020 turned out to be another above average season, temperature wise, for most of the United States. If you wish to play “The Climate Lottery” pick one number between 1 and 126 (with 1 representing the coldest possible ranking and 126 being the highest possible ranking) for June, July and August 2020. Also, pick a “Power Ball” or overall ranking number for Summer 2020 between 1 and 126. The Power Ball ranking will serve as a tiebreaker for any close picks between contestants. Your picks are NCEI rankings for average temperatures across the lower 48 states. Since 2020 is the 126th year that the National Center for Environmental Information has been ranking years since 1895 all months for 2020 will have a warmest ranking of 126. Monthly rankings for 2020 will have a range from 1 to 126 with the coldest ranking being the number 1.
Please give your picks to Guywalton10@gmail.com before July 6th, 2020. If you wait until just before July 6th to make your picks you can make an educated guess as to what the ranking for June will be and also a heads-up guess for July. All data can be found at the National Center for Environmental Information site noted here:
https://www.ncdc.noaa.gov/cag/national/rankings/110/tavg/202005
The Power Ball (or overall National Center for Environment Information) number for Spring 2020 for the lower 48 states was 107, which was well above the average ranking of 63, for the lower 48 states. In the Climate Lottery game, I’ve defined each individual lottery number as rankings for each month for the lower 48 states, power ball numbers as those for each season, and mega ball numbers as those for each year.
Chances for an entire season of below average temperatures are becoming much less likely across the lower 48 states due to carbon pollution. The whole point of these posts is to demonstrate how skewed temperatures have become towards warmth due to climate change and to get people to look at NCEI data. Of course, as far as the globe goes, the larger an area that is compared to average, the more likely that area is to be above long term averages. What has happened this decade is yet more proof of the climate lottery game being loaded for warmth in the United States. Balls coming out of the Climate Lottery hopper are likely to have high numbers.
Here’s a breakdown of the National Climatic Center’s ranking numbers by state for Spring 2020, which was ranked as 107th coolest (or a Powerball ranking of 107):
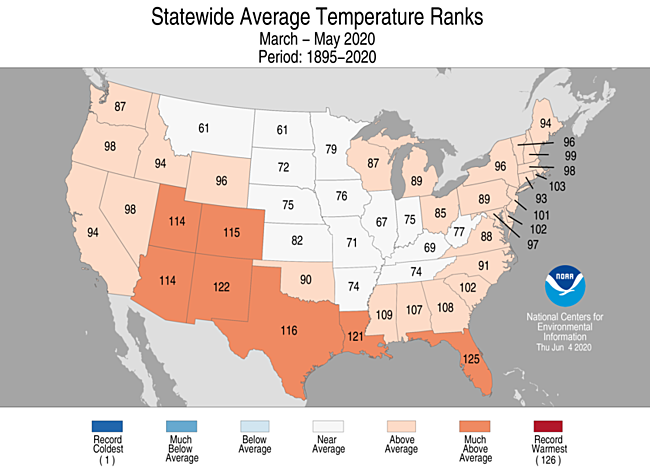
There were no states with below average rankings for Spring 2020. The southern tier of states had the most anomalous warmth.
The following is a breakdown of each month for Spring 2020. Each chart shows “Climate Lottery” numbers for each state (or rankings) from a scale of 1 to 126.
In March the overall ranking for the lower 48 states was 117 (out of 126 since a ranking of 126 was highest for 2020):
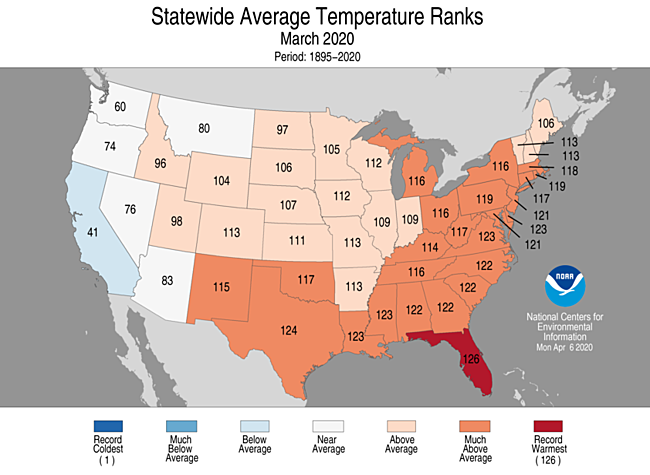
The core of the most anomalous warmth was in the southeastern states. For a change California saw below average conditions.
In April 2020 the overall ranking for the lower 48 states was 54 (out of 126):
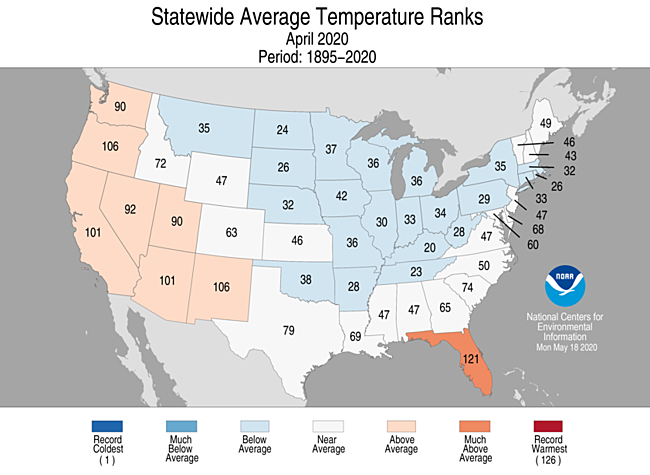
The Midwest saw a cooler than average April while the West and Florida experienced warmth.
In May 2020 the overall ranking for the lower 48 states was 77 (out of 126):
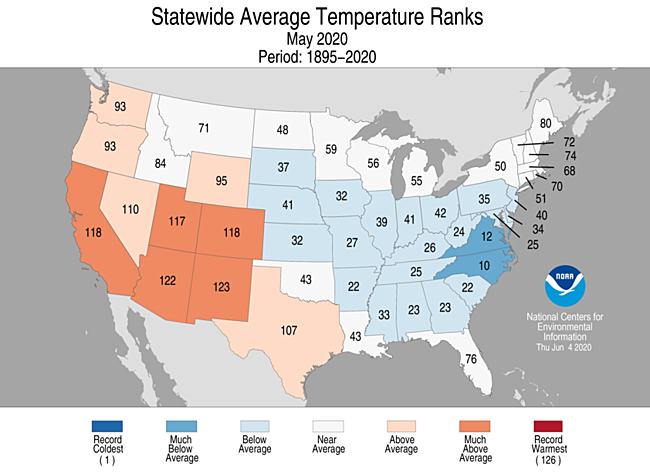
The most anomalous warmth occurred in the West. Cooler than average temperatures occurred in most areas east of the Rockies with the coldes5 conditions centered on the Mid-Atlantic states.
The following are the rankings, so far, for individual months or “climate lottery number picks” from 2011-2020:
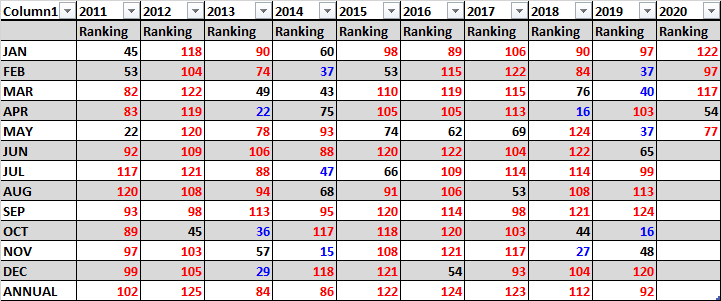
The average ranking for 2020 is 63 since the coldest ranking would be 1 and the hottest 126. I have color coded all rankings for this post at or below 43 blue and all those at or above 83 red with rankings + or – 20 from the mean value of 63 black. With time, the rankings for each individual month, season and year will change as more data becomes available from NCEI. Also, for reference, the annual or “mega ball” numbers are shown on the chart. The mega ball number for 2018 was 112 meaning that 2018 was the thirteenth warmest year on record for the lower 48 states.
Seasonal or Power Ball rankings for winter are those for DEC/JAN/FEB, spring are MAR/APR/MAY, summer JUN/JUL/AUG, and fall SEP/OCT/NOV. Also, keep in mind that NCEI rankings for seasons are not merely an average of rankings of individual month of a season or year as was the case for Spring 2020- 117/54/77 P.B.107:
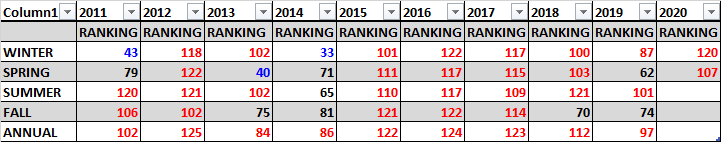
Notice that since the start of 2011 only three out of thirty-eight seasons have been well below average or “blue.” Twenty-seven out of thirty-eight seasons since 2011 have been “red” or above average. Spring 2020 was well above average, so was colored red. Indeed, the Climate Lottery hopper is very much loaded for above average temperatures for the lower 48 states looking at recent history. Yes, the “casino of climate averages” is cheating causing the “house of warming” to win just about every season due to carbon pollution.
I hope that everyone will have a great summer…and stay cool.
Guy Walton… “The Climate Guy”
Here is more climate and weather news from Wednesday:
(As usual, this will be a fluid post in which more information gets added during the day as it crosses my radar, crediting all who have put it on-line. Items will be archived on this site for posterity. In most instances click on the pictures of each tweet to see each article. The most noteworthy items will be listed first.)
Now here are some of today’s articles and notes on the horrid COVID-19 pandemic:
(As usual, the most noteworthy items will be listed first.)
(If you like these posts and my work please contribute via the PayPal widget, which has recently been added to this site. Thanks in advance for any support.)
Guy Walton “The Climate Guy”
My July 5th update.
My climate logo picks for Summer 2020 are: 109/122/97 with a Power Ball number of 118 for this season.
“The Climate Guy”