Wednesday July 29th… Dear Diary. The main purpose of this ongoing blog will be to track United States extreme or record temperatures related to climate change. Any reports I see of ETs will be listed below the main topic of the day. I’ll refer to extreme or record temperatures as ETs (not extraterrestrials).😉
Wednesday July 29, 2020/ Main Topic: Extreme Heat Report From Climate Central
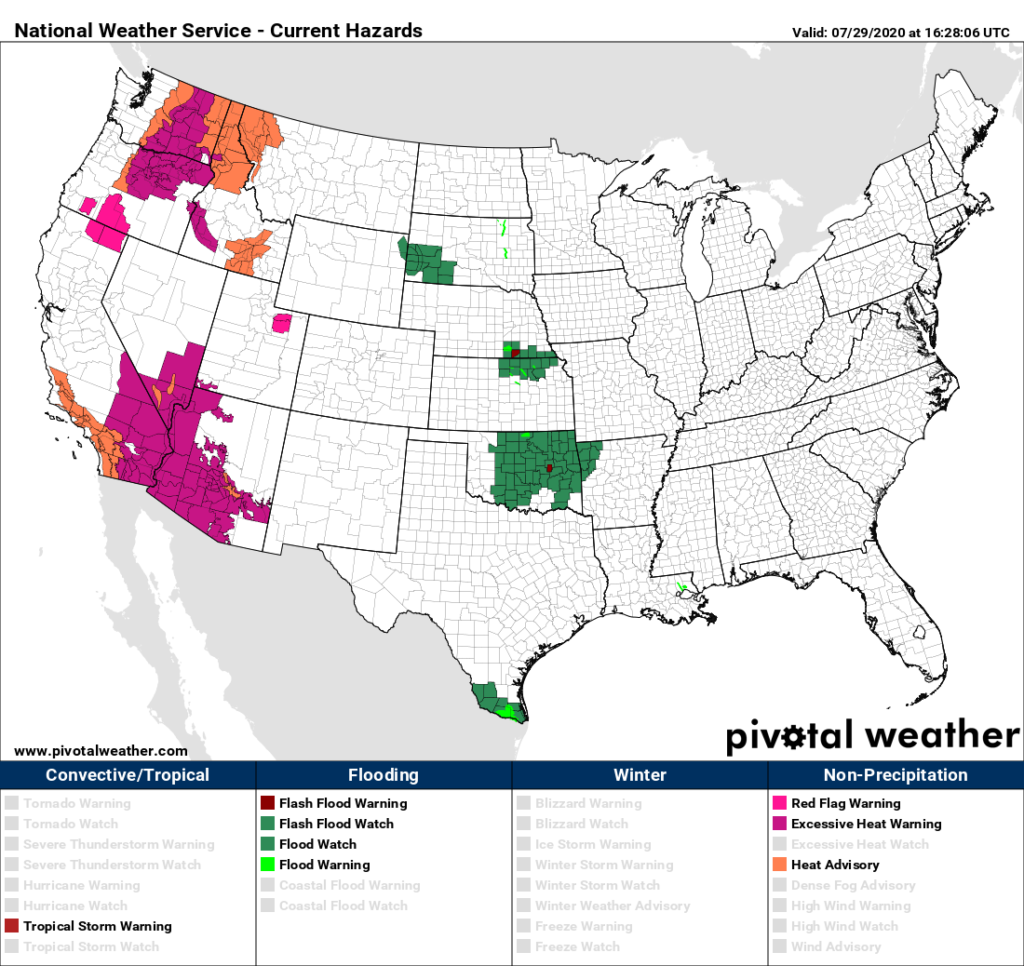
Dear Diary. The United States, as a whole, has experienced a hot July with above average temperatures, some breaking records. Our prolonged central and eastern heat wave ended a couple of days ago, but some dangerous heat persists along the East Coast. Now it’s the West’s turn to experience near record dangerous heat. Here is the forecast for Thursday:
Heat advisories and warnings from the National Weather Service are up for much of the interior portions of the West:
High, often anomalous, heat will become much more common as we move through the 21st century, unfortunately, due to carbon pollution. Climate Central has assessed extreme heat trends using the latest data through early 2020. Here is their report:
https://medialibrary.climatecentral.org/resources/2020-days-above-thresholds
- Climate Matters
- Resources
- 2020 More Extreme Heat
2020 More Extreme Heat
JUL 22, 2020
- EXTREME HEAT
- Market Versions Available
KEY CONCEPTS | POTENTIAL LOCAL STORY ANGLES
EXPERTS TO INTERVIEW | METHODOLOGY
KEY CONCEPTS
- Extreme heat looks much different today than just fifty years ago. Of the 242 cities analyzed, 142 (59%) experience three or more additional days of extreme heat. The ten cities recording the greatest increases in the number of extremely hot days were all in the southern United States ー seven of which were recorded in Texas alone.
- NASA and NOAA recently announced that 2020 year-to-date global temperatures are the 2nd-hottest on record, just behind 2016. Greenhouse gas emissions are changing the atmosphere, causing our climate to warm to a level that modern society has never experienced.
- Extreme heat is dangerous. It’s the top weather killer and is especially difficult to shelter from this year, as a result of the pandemic. The heat poses the most serious risks to outdoor workers and lower-income communities.

Find All Image Types Here (JPG & PNG)
Recently, the mercury in Death Valley, Calif. climbed to a blistering 128℉ ーthe hottest temperature recorded on earth since 2017. Shortly after, NASA and NOAA announced that global temperatures from the first half of 2020 are the 2nd-hottest on record, just behind 2016. Greenhouse gas emissions are changing the chemistry of the atmosphere, causing our climate to warm to a level that modern society has never experienced.
Extreme heat looks much different today than just fifty years ago. We analyzed how the number of extremely hot days has changed since 1970. While “extreme heat” means something different to each city ー from 70°F+ in Anchorage, AK to 110°F and over in Yuma, Ariz. ー these levels of heat are exceeded more and more often across the United States.
Of the 242 cities analyzed, 142 (59%) experience three or more additional days of extreme heat. The ten cities recording the greatest increases in the number of extremely hot days were all in the southern United States ー seven of which were recorded in Texas alone. All of the top ten recorded more than three additional weeks of extreme heat since 1970, while Miami led with a startling increase of seventy-seven days!
Extreme heat is dangerous. It’s the top weather killer (surpassing flooding and tornadoes), and is especially difficult to shelter from this year, as a result of the pandemic. The heat poses a serious occupational hazard for outdoor workers and disproportionately threatens lower-income communities, whose access to air conditioning is typically more limited. In recent years, many cities have stepped up their adaptation efforts, coming up with novel strategies and protocols for protecting citizens during bouts of extreme heat. Ultimately, though, there’s no way around cutting our greenhouse gas emissions if we hope to turn down the global thermostat.
NOAA REPORT
Last week, NOAA released a report finding sea level rise flooding of U.S. coastlines is happening now, and is becoming more frequent each year. Check out Climate Central’s Coastal Risk Screening Tool to explore flood threats along the U.S. coasts.
POTENTIAL LOCAL STORY ANGLES
How are these changes affecting health?
In June, the Global Heat Health Information Network issued a peer-reviewed technical brief on the compound risks of heat and COVID-19, as well as recommendations for communities and health systems. The 2018 National Climate Assessment details how the rise of extreme heat is already impacting health. The CDC distills these health risks into infographics (both English and Spanish).
What work is being done to protect vulnerable populations?
Many such efforts were discussed in Climate Central’s recent webinar on extreme heat and COVID-19. Related resources include an EPA guidebook for excessive heat response, stories and projects from ISeeChange, and example strategies from the National Integrated Heat Health Information System.
How is COVID-19 affecting our responses to this summer’s extreme heat?
The C-CHANGE program at the Harvard T.H. Chan School of Public Health describes the unique challenges of mitigating the impact of extreme heat during this pandemic. The CDC has released guidance on considerations for reducing the risk of COVID-19 spread while operating cooling centers.
EXPERTS TO INTERVIEW
Local Experts
The National Weather Service (NWS) operates 122 local weather forecast offices across the country. Check in with the NWS office in your area to find out about any upcoming heat forecasts, heat advisories and excessive heat warnings. Find out what steps are being taken in your locality to beat the heat — ask local officials about your city’s heat response plan, and see if the EPA database on community responses to urban heat islands includes your area.
The SciLine service, 500 Women Scientists or the press offices of local universities may be able to connect you with local scientists who have expertise on extreme heat in your area. The American Association of State Climatologists is a professional scientific organization composed of all 50 state climatologists.
National Experts
Ahira Sánchez-Lugo, Physical Scientist, NOAA National Centers for Environmental Information (NCEI), Center for Weather and Climate (CWC)
Ahira.Sanchez-Lugo@noaa.gov
*Available for interviews in Spanish and English
Kristie Ebi, Professor, Environmental and Occupational Health, Global Health, University of Washington
Research interests include: impacts of and adaptation to climate variability and change, including extreme events, thermal stress, vector-borne diseases, foodborne safety and security.
krisebi@uw.edu
METHODOLOGY
Data was gathered via the Applied Climate Information System. To select the primary temperature threshold for each city, an “extremely hot day” is defined as the highest 5°F increment temperature that occurred at least four days during more than half of the years of the study period (1970-2019). Change in the number of days is based on linear regression.
Climate Central’s local analyses include 244 stations. However, for data summaries based on linear trends, only 242 stations are included due to large data gaps in St. Johnsbury, Vermont and Wheeling, West Virginia.
NOTE: If you would like a different temperature threshold for your city, please let us know.
…………………………………………………………….
Tomorrow we will revisit the 2020 Siberian Heat Wave, keeping in mind some of the things learned via Climate Central in today’s post.
Here are some more impressive “ET’s” reported on Wednesday:
Here is more climate and weather news from Wednesday:
(As usual, this will be a fluid post in which more information gets added during the day as it crosses my radar, crediting all who have put it on-line. Items will be archived on this site for posterity. In most instances click on the pictures of each tweet to see each article. The most noteworthy items will be listed first.)
Now here are some of today’s articles and notes on the horrid COVID-19 pandemic:
(If you like these posts and my work please contribute via the PayPal widget, which has recently been added to this site. Thanks in advance for any support.)
Guy Walton… “The Climate Guy”