The main purpose of this ongoing blog will be to track United States extreme or record temperatures related to climate change. Any reports I see of ETs will be listed below the main topic of the day. I’ll refer to extreme or record temperatures as ETs (not extraterrestrials).😉
Main Topic: The Mass Of Human-Made Materials Now Equals The Planet’s Biomass
Dear Diary. Most often, obviously, I will highlight articles on the planet’s temperature, heat or cold waves, and extreme weather events, all of which have been affected by carbon pollution. Today let’s focus on another aspect of humanity that is making our world warmer by indirectly causing us to pump more carbon in the air, and that is our materialistic lifestyles.
Let’s face it. Every time you order a pizza or something on Amazon, more than likely you are producing climate warming carbon pollution. Energy it takes to create something or mine minerals going into parts for your Amazon goodie, grow the food that becomes that pizza, refine the fuel to transport the pizza, and the fiber needed to make the cardboard box containing the pizza is likely coming mostly from fossil fuels.
I was not too surprised to learn that as of 2020 that all humanly manufactured products now equal in mass to what the planet grows, or natural biomass. Also, this “anthropogenic” mass is doubling every twenty years, which should alarm my readers even more than they already are over just the effects of burning fossil fuels alone for transportation and to produce electricity. Here are more details from Desdemona Despair:
demona Despair
December 10, 2020
The mass of human-made materials now equals the planet’s biomass – “Anthropogenic” mass is doubling every twenty years
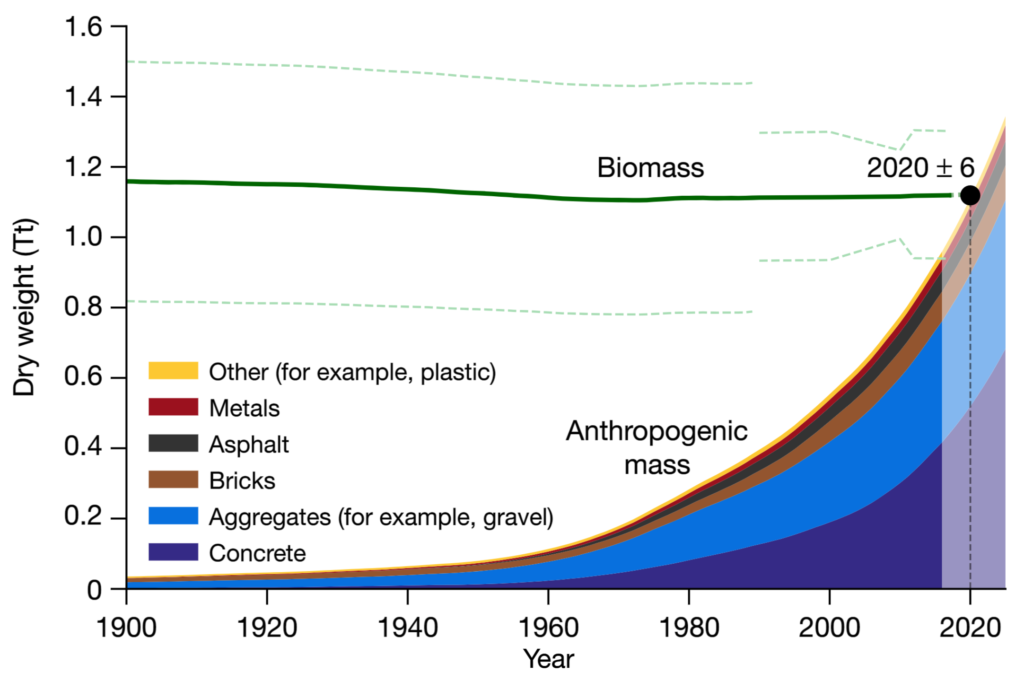
9 December 2020 (Weizmann Institute of Science) – Earth circa 2020: The mass of all human-produced materials – concrete, steel, asphalt, etc. – has grown to equal the mass of all life on the planet, its biomass. According to a new study at the Weizmann Institute of Science, we are right at this tipping point, and humans are currently adding new buildings, roads, vehicles and products at a rate that is doubling every 20 years, leading to a “concrete jungle” that is predicted to reach over two teratonnes (i.e. two million million) – or more than double the mass of living things, by 2040.
The study, published today [pdf] in Nature and conducted in the group of Prof. Ron Milo of the Plant and Environmental Sciences Department by Emily Elhacham and Liad Ben Uri, shows that at the outset of the 20th century, human-produced “anthropogenic mass” equaled just around 3% of the total biomass. How did we get from 3% to an equivalent mass in just over a century? Not only have we humans quadrupled our numbers in the intervening years, the things we produce have far outpaced population growth: Today, on average, for each person on the globe, a quantity of anthropogenic mass greater than their body weight is produced every week.
The upswing is seen markedly from the 1950s on, when building materials like concrete and aggregates became widely available. In the “great acceleration” following World War II, spacious single-family homes, roads and multi-story office buildings spang up around the US, Europe and other countries. That acceleration has been ongoing for over six decades, and those two materials, in particular, make up a major component of the growth in anthropogenic mass:
What do we have more of in the world, by mass: Concrete or animals? Plastic or plants? And can we identify the tipping point when one will outweigh the other? Prof. Ron Milo, of the Weizmann Institute of Science, has analyzed the proportions of anthropomass (human-made) to biomass on planet Earth, and has some interesting answers to these questions. Video: Weizmann Institute of Science
“The study provides a sort of ‘big picture’ snapshot of the planet in 2020. This overview can provide a crucial understanding of our major role in shaping the face of the Earth in the current age of the Anthropocene. The message to both the policy makers and the general public is that we cannot dismiss our role as a tiny one in comparison to the huge Earth. We are already a major player and I think with that comes a shared responsibility.” says Milo.
Referring to the dynamics of the human-made materials in our world as a “socio-economic metabolism,” the study invites further comparison with the way that natural materials flow through the planet’s living and geologic cycles. “By contrasting human-made mass and biomass over the last century, we bring into focus an additional dimension of the growing impact of human activity on our planet,” says Elhacham.
Milo: “This study demonstrates just how far our global footprint has expanded beyond our ‘shoe size.’ We hope that once we all have these somewhat shocking figures before our eyes, we can, as a species, behave more responsibly.”
Milo and Elhacham teamed with graphic designer Itai Raveh to create a website, Anthropomass.org, to help explain these figures in clear, simple terms.
The Mass of Human-Made Materials Now Equals the Planet’s Biomass
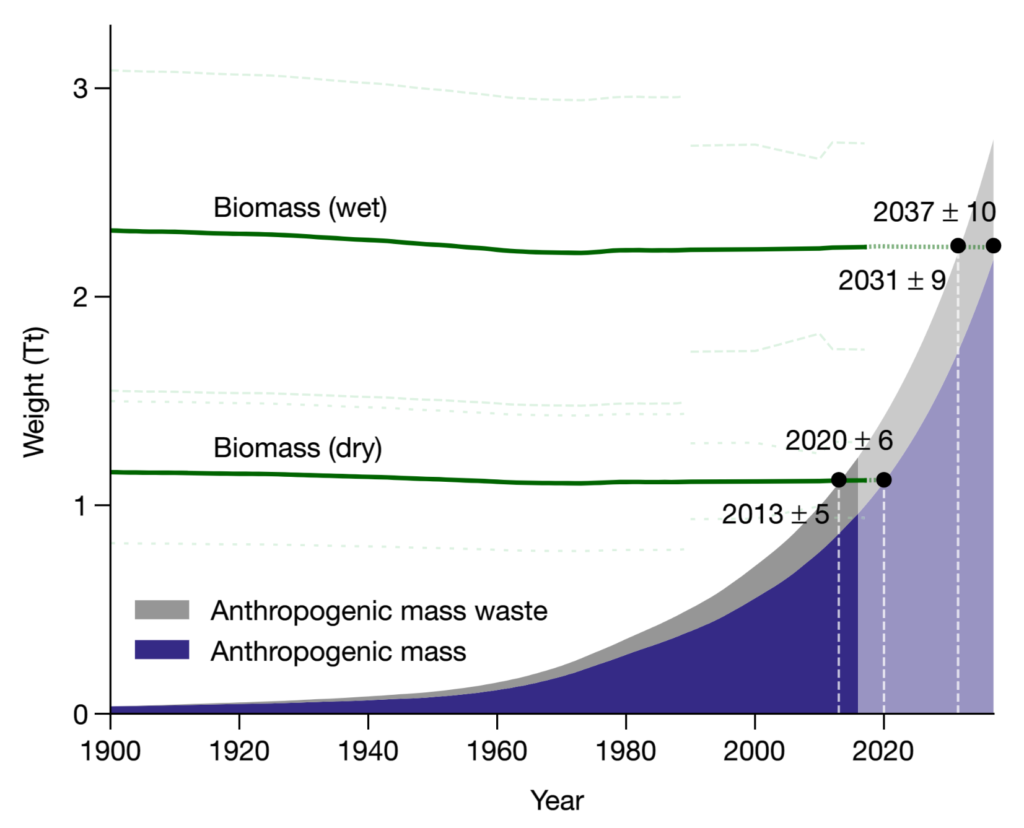
ABSTRACT: Humanity has become a dominant force in shaping the face of Earth1,2,3,4,5,6,7,8,9. An emerging question is how the overall material output of human activities compares to the overall natural biomass. Here we quantify the human-made mass, referred to as ‘anthropogenic mass’, and compare it to the overall living biomass on Earth, which currently equals approximately 1.1 teratonnes10,11. We find that Earth is exactly at the crossover point; in the year 2020 (± 6), the anthropogenic mass, which has recently doubled roughly every 20 years, will surpass all global living biomass. On average, for each person on the globe, anthropogenic mass equal to more than his or her bodyweight is produced every week. This quantification of the human enterprise gives a mass-based quantitative and symbolic characterization of the human-induced epoch of the Anthropocene.
Global human-made mass exceeds all living biomass
……………………………………………………………
My biggest question for today is whether or not our materialism will kill us? I know that the planet has the capability to give us many more raw materials for manufacturing than are currently being harnessed now, but at what point will our needs, mostly due to population growth, exceed what Earth can give us? Think about that the next time you order a pizza with the works.
Here is more climate and weather news from Saturday:
(As usual, this will be a fluid post in which more information gets added during the day as it crosses my radar, crediting all who have put it on-line. Items will be archived on this site for posterity. In most instances click on the pictures of each tweet to see each article. The most noteworthy items will be listed first.)
Now here are some of today’s articles and notes on the horrid COVID-19 pandemic:
(If you like these posts and my work please contribute via the PayPal widget, which has recently been added to this site. Thanks in advance for any support.)
Guy Walton “The Climate Guy”