The main purpose of this ongoing blog will be to track planetary extreme or record temperatures related to climate change. Any reports I see of ETs will be listed below the main topic of the day. I’ll refer to extreme or record temperatures as ETs (not extraterrestrials).😉
Main Topic: Revisiting The Extreme Temperature Index…February’s Most Extreme U.S. Records
Dear Diary. Before moving onto bigger topics this week, such as the crucial impending Biden green infrastructure bill, let’s have some fun with a little simple math. For this purpose I will reintroduce an oldie but goodie, the Extreme Temperature Index, or ETI for short. Here we will try to determine which two locations across the nation had the most extreme temperatures, or the furthest away from climatological averages…not just the absolute coldest or warmest…for February 2021.
First, it has been quite a while since we did any ETI calculations for the main daily topic on this blog, so here is a little history and a couple of examples of the Index from a prior post:
The Extreme Temperature Index: Identifying Which Records are Most Significant
By: Guy Walton 4:16 PM GMT on March 21, 2017
Our guest author today on Category 6 is Guy Walton, an independent meteorologist in Atlanta who spent more than 30 years as a forecaster at The Weather Channel. For more than a decade, Guy has kept detailed records on U.S. daily, monthly, and all-time record high and low temperatures across the United States. His efforts helped lead to NOAA’s establishment of its U.S. Records site. In 2009, Guy coauthored a high-profile paper in Geophysical Research Letters with lead author Gerald Meehl (National Center for Atmospheric Research), showing that U.S. daily record highs have increasingly outpaced daily record lows since the 1980s. Guy’s work can be found on Twitter (@climateguyw) and on his new website, Guy on Climate (not to be confused with an unrelated site called “Climate Guy”).
In 2007, when Bob Henson and I were first discussing the potential for a new climate study based on U.S. ratios of record surface highs to lows, we thought that it would be fantastic to engineer an index that would allow for ranking, rating, and comparing individual tallies.
Up to now, I’ve carried out my research without such an index. My most recent analysis uses record ratios to show that U.S. nights are actually warming faster than days, most likely due to carbon pollution interacting with moisture.
Studies like this one pit one tally of a set record against another. One problem that Bob and I recognized early on is that a report, or tally, of a surface record could be a tied record coming from a station with only a period of record (time that a station has been reporting reliable temperature measurements) of 30 years, or a report from a station with a period of record well over 100 years breaking an old record by several degrees. So we have been proverbially comparing apples to oranges.
Bob and I thought there ought to be some simple mathematical index taking into account variables hidden in those individual record tallies. The first two variables were obvious: (1) the period of record, or the length of time that regular observations have been collected at a given location, and (2) the difference (e.g., degrees Fahrenheit) between the old record and new. Bob also thought that the difference between the average maximum and minimum at each location on each given date is a factor and should be built into an algorithm or index. The name we came up with is the Extreme Temperature Index (ETI).
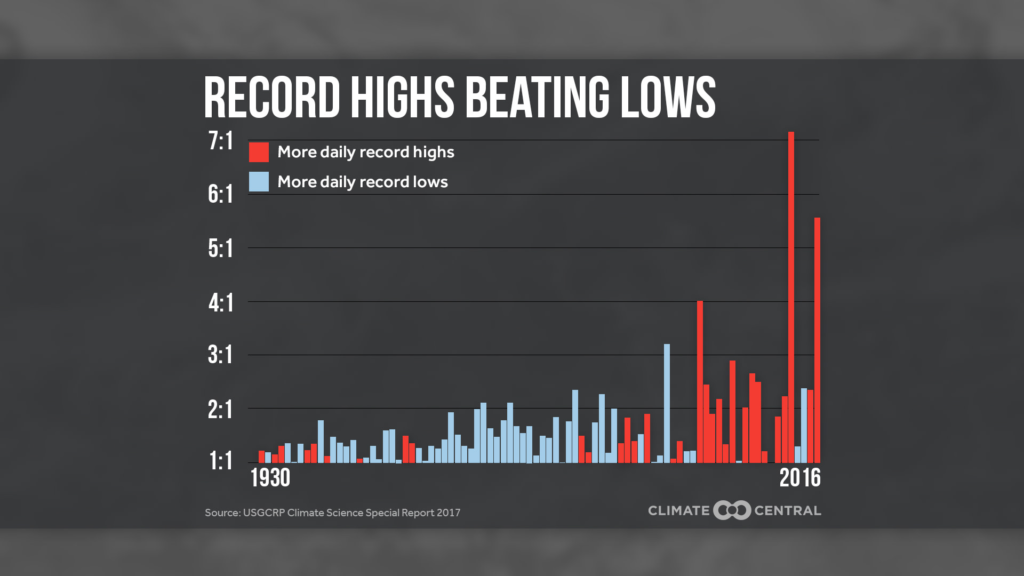
Figure 1. In the United States, record highs have outpaced record lows by an increasing margin since the 1980s. Shown here are the annual ratios of daily record highs to daily record lows for each year since the 1920s, when enough reliable data had accumulated to begin calculating such ratios. The only two years this century with more record lows than highs were 2013 and 2014. Image credit: Climate Central.
How the ETI works
Think about this: During the middle of the summer at Miami, FL, the average low is near 80°F while the average high is near 90°F, so the average diurnal temperature spread there is 10°F. Miami has a marine climate while Des Moines, IA, has a continental climate. The average low at Des Moines during that same midsummer day may be 60°F with a max near 85°F, or a spread of 25°F. Because of these differing spreads, it should be easier to exceed a record high or low by a margin as large as, say, 2°F in Des Moines versus Miami. Therefore, a useful ETI will generally weigh a statistical tally higher for a record set in a more marine environment than in a continental one, or at a lower-elevation site versus a higher-elevation one. These factors do not have to be explicitly added, though; they are incorporated automatically because of their influence on the average diurnal temperature spread.
Dr. Bruce Rose, a good colleague of mine at The Weather Channel for more than a decade, came up with an initial algorithm for the ETI:
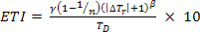
where
γ = sign of record (-1 = record low, +1 = record high)
n = number of years of record keeping (period of record, or POR)
| ΔTγ | = magnitude of record, in degrees
TD = average diurnal temperature range on day of record, in degrees
The ETA would work in either degrees Celsius or Fahrenheit. The beta exponent, which could be used to calibrate the ETI for monthly and all-time records, can be neglected here.
Using some simple mathematics, one can see how the ETI might work. All else being equal, the ETI will increase as n, the period of record, increases. The ETI will also increase in line with the magnitude of the difference between an old record and a new one. And if the average diurnal range of temperature gets larger, then the ETI number gets smaller.
The following are a couple of examples from the hot summer of 2007 calculated from the ETI algorithm. The periods of record shown here are for specific reporting sites as of 2007, rather than for the two cities as a whole.
Tupelo, MS (TUP):
n = 44 (as of 2007)
record high = 103
previous record high = 101
normal diurnal range for date = 89/72
ETI = + [(1 – .023)(2 + 1)/17] x 10 = 1.72
Louisville, KY (SDF):
n = 59
record high = 105
previous record high = 100 (monthly record)
normal diurnal range for date = 86/68
ETI = + [(1 – .017)(5 + 1)/20] x 10 = 2.95
As shown, we get an ETI value that is greater for Louisville than in Tupelo. The daily record at Louisville (which also happens to be a monthly record) is clearly more significant than the daily record set in Tupelo.
An idea ready for research
By 2009, we had the framework for the ETI in hand, and off we went to do a scientific paper, right? Eh…wrong. All of us had competing priorities, and to be honest, I lack the mathematical and statistical skills to produce such a paper. I have brought the ETI concept to many individuals who love the idea of ranking records but who have also been too busy with other priorities to take on this project. So, if any graduate student or other individual wants to take a serious look at the viability of the Extreme Temperature Index, just contact me or Bob, and you have our blessing.
The more direct way of judging a record hot or cold event is its standard deviation from average (also known as its sigma value). These can be evaluated locally or across a region. For example, the Russian heat wave event of 2010 was deemed a “three sigma” event, or a very rare hot event far outside of norms or averages. An interesting alternative way for ranking a heat wave, if enough long-term observations are present, would be to take all the deemed tallies of records of said event and put them through the ETI algorithm. The local results could be added and then divided by the number of tallies to produce a regionally averaged Extreme Temperature Index (ETI) for that heat wave. Such a method could allow climatologists to better compare events from different eras.
WU weather historian Christopher Burt and I have envisioned a great repository of surface records from the entire planet. Based on this dataset, each new record would have its own calculated ETI to help meteorologists and climatologists better compare cold or hot events. The U.S. Records site (NOAA/National Center for Environmental Information), where I get my tallies, is a good start. By using some sort of ETI, I believe it could be vastly enhanced.
Any serious work on the ETI could prove to be both a personal opportunity and beneficial to science. For those who are interested, have at it!
To achieve our goal of determining which two locations (one hot and one cold) had the most extreme record temperatures during February we first need to look at records from this NCEI web site:
https://www.ncdc.noaa.gov/cdo-web/datatools/records
Obviously the two picks among thousands of records are heavily weighted on departure from temperature average.
The cold extreme temperature pick was one among dozens of all-time minimums:
| STATION | DATE | RECORD | PREV. DATE | PREV. RECORD | NUMBER OF YEARS | DIFFERENCE |
|---|---|---|---|---|---|---|
| BATTIEST, OK US | 2021-02-16 | -14 | 1989-12-23 | -4 | 36 | -10 |
Battiest Oklahoma broke its all-time record by a full ten degrees but is a relative young station, having recorded climatological temperature data for only 36 years. Here is the ETI calculation from this data using climatological data for Fort Smith Arkansas, the closest major station:
Battiest, OK:
n = 36 (as of 2021)
record low min = -14°F
previous record daily low = +6°F
normal diurnal range for 2/16 = 57°F-37°F=20
ETI = – [(1 – .028)(20 + 1)/20] x 10 = -10.21
Our warm candidate only had a monthly record since all-time maxes are not recorded in February:
| STATION | DATE | RECORD | PREV. DATE | PREV. RECORD | NUMBER OF YEARS | DIFFERENCE |
|---|---|---|---|---|---|---|
| DAUPHIN ISLAND NUMBER 2, AL US | 2021-02-12 | 81 | 2017-02-26 | 77 | 45 | 4 |
Here is the ETI calculation for our warm spot using Mobile, AL climatology (The closest major site to Dauphin Island) :
n = 45
record high = 81°F
previous daily record high = 74°F
normal diurnal range for date = 65°F-44°F= 21
ETI = + [(1 – .02)(7 + 1)/21] x 10 = +3.73
Here we see from the ETI calculates that our all-time minimum record is more significant than our monthly maximum record by 7 points, which is no surprise. Battiest, OK gets our grand prize for February 2021, having the most extreme record or temperature set in the United States.
If you are reading this and are a grad student, perhaps you would like to refine the ETI algorithm for a doctoral thesis. Bob Henson and I are welcoming people to this project to advance climatological and meteorological science.
Here are some “ET’s” reported from Thursday:
Here is more climate and weather news from Thursday:
(As usual, this will be a fluid post in which more information gets added during the day as it crosses my radar, crediting all who have put it on-line. Items will be archived on this site for posterity. In most instances click on the pictures of each tweet to see each article. The most noteworthy items will be listed first.)
Now here are some of today’s articles and notes on the horrid COVID-19 pandemic:
(If you like these posts and my work please contribute via the PayPal widget, which has recently been added to this site. Thanks in advance for any support.)
Guy Walton “The Climate Guy”
The big problem with this ETI formula is that some dates have records that are easy to beat. So instead of comparing to the record for the date, use the lowest record for any date after the current date. For unusual high max’s compare to the highest record up to and including the current date. Of course in the fall it’s the other way around.
BTW I would love to see the ETI for Sault Sainte Marie MI 2012-3-21.
Great point Alan. Would you or someone you know be interested in working on the algorithm for a doctoral thesis?
If so, be my guest.
Yes, if only I were 55 years younger! (Just stumbled upon your reply today, sorry for delay).