The main purpose of this ongoing blog will be to track planetary extreme, or record temperatures related to climate change. Any reports I see of ETs will be listed below the main topic of the day. I’ll refer to extreme or record temperatures as ETs (not extraterrestrials).😉
Main Topic: U.S. October Record Scoreboard
Dear Diary. It’s time once again for our monthly climatological review. Here on this site, we present monthly summaries near the 8th of each month, and each is available if you want to go back through my Extreme Temperature Diary archive under my “Record Scoreboard Climatological Reviews” category (located on the upper left-hand corner of my home page).
https://guyonclimate.com/category/record-scoreboard-climatological-reviews/
I’m repeating this mantra every month:
October 2022 using 1901-2000 mean data got ranked by the National Center for Environmental Information for the lower 48 states as 29th warmest, or 100th coolest since records began being kept in 1895:
https://www.ncdc.noaa.gov/cag/national/rankings
Well above average temperatures were experienced across the West and in New England. Washington state had its warmest October on record. Much of the southern Midwest and South had below average temperatures.

Brief summary for October 2022: Most reports of record heat came from the Plains during the early and last parts of the month. A cold shot of air produced most record chill across the Midwest during mid-October. It was hot enough to produce 6 reports of all-time records in the West.
Also:
Here are my two U.S. Daily Record Scoreboards updated through 11/08/2022 (data compiled from the following NCEI site):
https://www.ncdc.noaa.gov/cdo-web/datatools/records
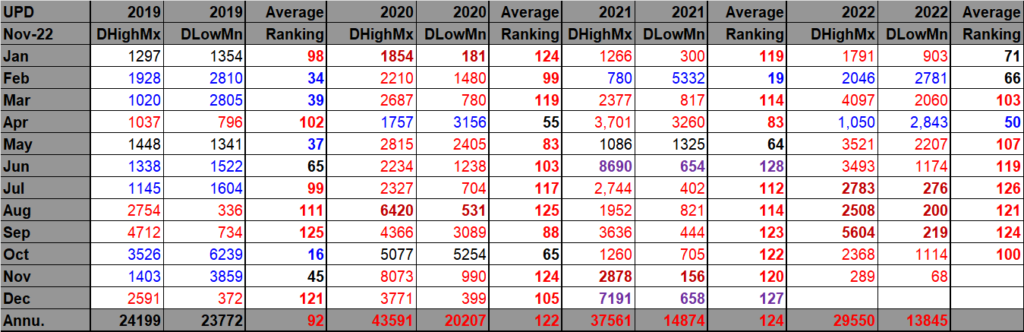

Record numbers statistically matched up well during October of 2022 with that month being the 29th warmest October on record.
October 2022 had approximately a 2 to 1 ratio of record DHMX to DLMN individual record counts, so the color I used for this month was red on the top chart.
October 2022 had approximately a 3 to 1 ratio of record DHMN to DLMX individual record counts, so the color I used for this month was red on the bottom chart.
Due to climate change, we are seeing fewer blue colors on these Record Scoreboards with time, and October 2022 added to this trend.
As stated, the ranking for October 2022 was 100, which was colored red since it was well above average.
I color rankings of +20 or -20 from the average ranking for the lower 48 states of 64 black, indicating that these are near average temperature wise. The top warmest ranking for 2022 would be 128 since rankings began in 1895.
November 2022 has gotten off to a very warm start across the East and South. Conditions will cool significantly across the eastern part of the U.S. later this week and remain colder than average across the Midwest for much of November. We still will probably see more reports of record warmth than chill this month, though.
Here is much more detailed climatology for October 2022 as complied by NOAA:
https://www.ncei.noaa.gov/news/national-climate-202210
Assessing the U.S. Climate in October 2022
Drought extends across nearly two-thirds of the Lower 48; Mississippi River at lowest water levels in a decade

Courtesy of Getty Images
PUBLISHED
NOVEMBER 8, 2022
Key Points:
- The average temperature of the contiguous U.S. in October was 55.3°F, which is 1.2°F above average, ranking in the warmest third of the record. Generally temperatures were above average in New England and from parts of the central and northern Plains to the West Coast.
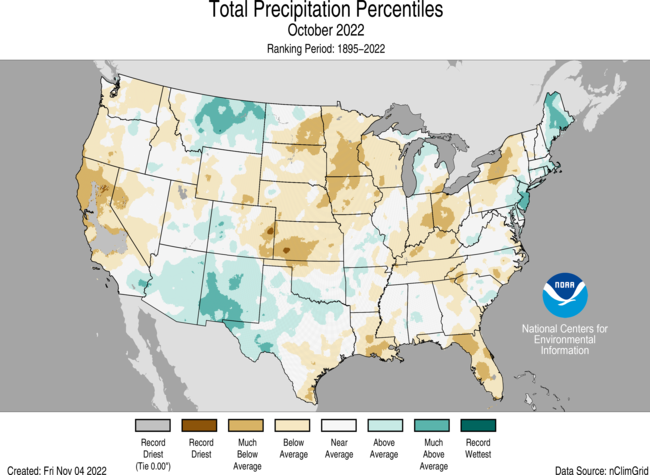
- October precipitation for the contiguous U.S. was 1.66 inches, 0.50 inch below average, ranking in the driest third of the historical record. Precipitation was above average in Montana and across parts of the Northeast and Southwest and below average across portions of the West, central and northern Plains, Midwest and Southeast.
- On October 13, the U.S. Drought Monitor (USDM) revealed nearly 82% of the continental U.S. to be abnormally dry or in drought, the largest area affected in the history of the USDM, which launched in 2000.
- The lowest water levels in the Mississippi River in a decade, caused by a severe Midwest drought, restricted access to the vital channel to barge traffic at a crucial time of the year for the transport of crops from the nation’s heartland.
- A historic mid-October heatwave brought summer-like heat, shattering daily high records across the Pacific Northwest.According to the November 1 U.S. Drought Monitor report, about 62.8% of the contiguous United States was in drought. Severe to exceptional drought was widespread from the Great Basin to the Pacific Coast, across portions of the Great Plains to Mississippi Valley, and in Hawaii, with moderate to severe drought in parts of the Southeast and Northeast.

Other Highlights:
Temperature

For the month of October, Washington ranked warmest on record, Oregon ranked second warmest, Maine sixth warmest and California ranked seventh warmest on record for this period.
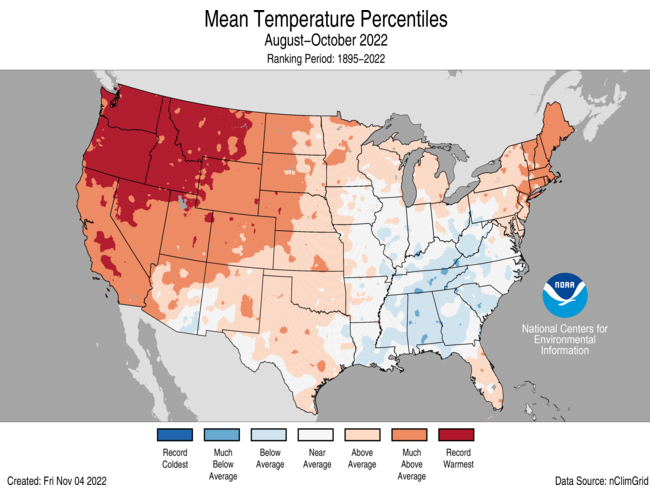
Temperatures were above average across much of the contiguous U.S. during the August-October period with record warmth blanketing much of the Northwest. Oregon, Washington, Idaho and Montana each had their warmest August-October period on record. The Southeast was cooler than average for this period.

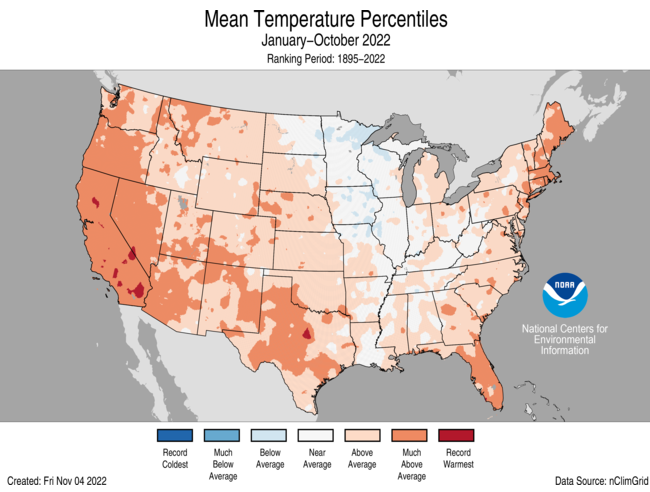
For the January-October period, the average contiguous U.S. temperature was 56.7°F, 1.7°F above average, ranking 13th warmest in the 128-year record. Temperatures were above average from the West Coast to the Gulf Coast and from the Gulf to New England. California ranked third warmest while Oregon ranked sixth warmest on record for this period. Temperatures were near average from the Mississippi Delta to the Upper Midwest.
The Alaska statewide October temperature was 28.8°F, 3.3°F above the long-term average. This ranked in the warmest third of the 98-year period of record for the state. Temperatures were above average across the Panhandle, Aleutians, Yukon Delta, North Slope and parts of the eastern interior while much of the interior experienced near-average conditions for the month.
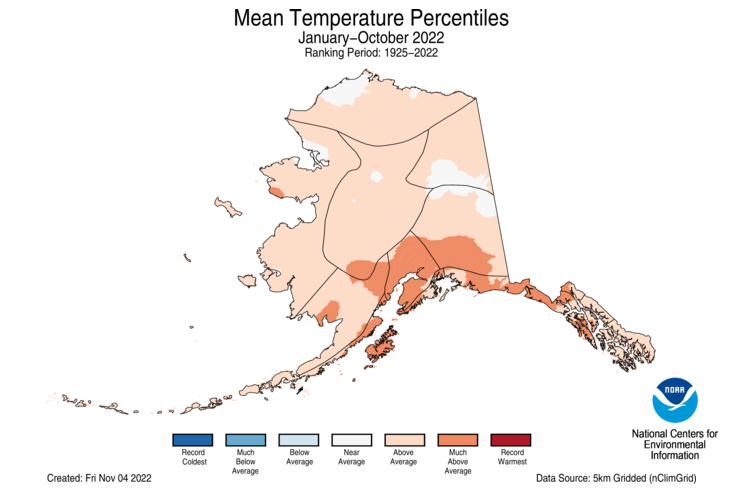
The Alaska January-October temperature was 32.2°F, 2.5°F above the long-term average, ranking in the warmest third of the record for the state. Above-average temperatures were observed across much of the state with small portions of the North Slope and eastern interior regions experiencing near-average conditions for this 10-month period.
Precipitation
Precipitation varied across the contiguous U.S. On the dry side, Florida ranked eighth driest while California and Minnesota each had their 11th-driest October on record. Conversely, an abundance of precipitation received during the month resulted in New Jersey ranking 10th-wettest on record.


The January-October precipitation total for the contiguous U.S. was 23.19 inches, 2.17 inches below average, ranking 15th driest in the historical record. Precipitation was above average across portions of the Southwest, Mississippi, Tennessee and Ohio valleys as well as the Northeast. Precipitation was below average across much of the West, central and southern Plains and parts of the East Coast during the January-October period. California ranked driest on record while Nebraska ranked fourth driest and Nevada eighth driest for this 10-month period.

Monthly precipitation averaged across the state of Alaska was 5.57 inches, 1.18 inches above average, ranking as the third-wettest October in the 98-year record. Much of the state was wetter-than-average, with portions of the Aleutians, southern interior and Kenai Peninsula experiencing near-average conditions during the month.

The January-October precipitation ranked wettest on record for Alaska, with above-average to record wet precipitation observed across much of the state. The central and Northeast Interior regions as well as the Aleutians experienced near-average precipitation for this period.
Other Notable Events
The Mississippi River was at its lowest water levels in a decade, reported near Memphis, TN, and Vicksburg, MS, restricted access to a vital channel to barge traffic at a crucial time of the year for transport of crops from the nation’s heartland. Since early October, the U.S. Coast Guard reported a total of eight barges that have run aground. 144 vessels and 2,253 barges were in a queue to access narrow passages of the river.
On October 1-5, the National Weather Service issued coastal flood alerts along the Mid-Atlantic coast, affecting about 30 million people, as remnants of Hurricane Ian churned off the East Coast. Reports of flooding occurred from the Carolinas to New Jersey.
On October 16, a historic October heatwave brought summer-like heat, shattering daily high temperature records, across the Pacific Northwest.
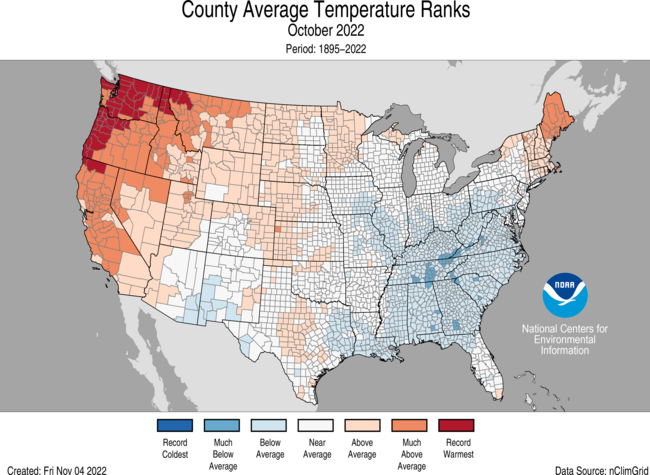
- Seattle, WA, broke its previous record high temperature on this day by a staggering 16°F.
- Portland, OR, set records on seven days in October, reaching at least 80°F on 12 days, doubling the previous October record.
On October 20, Portland, OR, and Seattle, WA, ranked first and second respectively for the worst air quality among the world’s major cities, according to IQAIR, as smoke from a string of wildfires darkened skies across parts of the Pacific Northwest.
On October 22-24, a storm moving through the western United States brought cold air and the first substantial snow of the season to parts of Montana, Colorado, Utah and California.
On October 29, at least five tornadoes were confirmed after a severe weather outbreak along the Mississippi and Alabama Gulf Coast. The National Weather Service confirmed that three tornadoes touched down in Jackson County, MS, each with top winds estimated between 100-110 mph, and two other weaker tornadoes were confirmed in Alabama.
Drought
According to the November 1 U.S. Drought Monitor report, about 62.8% of the CONUS was in drought, up about 11.9% from the end of September. Drought conditions expanded or intensified across much of the Southeast and Mississippi, Ohio and Tennessee valleys, and parts of the Plains, central Rockies, and Northwest. Drought contracted or was eliminated across portions of the Southwest, southern Plains, Northeast and Hawaii.
Monthly Outlook
According to the October 31 One-Month Outlook from the Climate Prediction Center, areas from the Southwest to the Northeast and across western and northern Alaska are most likely to see above-normal monthly mean temperatures in November, with the greatest odds in New England. The best chances for below-normal temperatures are forecast for southeast Alaska, the Pacific Northwest and the northern Rockies. Much of the West, portions of the central Plains as well as northwestern Alaska are favored to see above-normal monthly total precipitation, with the greatest chance near the northern Rockies. Below-normal precipitation is most likely to occur from south Texas to the Gulf of Mexico and the eastern third of the U.S. Drought is likely to persist across much of the West, Plains, and Mississippi and Ohio valleys. Some improvement and/or drought removal is likely across portions of the central and southern Plains, Northwest and Hawaii. Drought development is likely across portions of the Southeast.
According to the One-Month Outlook issued on November 1 from the National Interagency Fire Center, Hawaii and portions of the southern Plains, Midwest, Gulf states, and Mississippi, Ohio and Tennessee valleys have above normal significant wildland fire potential during November.
This monthly summary from NOAA National Centers for Environmental Information is part of the suite of climate services NOAA provides to government, business, academia and the public to support informed decision-making. For more detailed climate information, check out our comprehensive October 2022 U.S. Climate Report scheduled for release on November 14, 2022.
Here are some “ET’s” recorded from around the planet the last couple of days, their consequences, and some extreme temperature outlooks:
Here is some new October 2022 climatology:
Here is more climate and weather news from Tuesday:
(As usual, this will be a fluid post in which more information gets added during the day as it crosses my radar, crediting all who have put it on-line. Items will be archived on this site for posterity. In most instances click on the pictures of each tweet to see each article. The most noteworthy items will be listed first.)
More on Nicole:
Other Items:
If you like these posts and my work please contribute via the PayPal widget, which has recently been added to this site. Thanks in advance for any support.)
Guy Walton… “The Climate Guy”