The main purpose of this ongoing blog will be to track planetary extreme, or record temperatures related to climate change. Any reports I see of ETs will be listed below the main topic of the day. I’ll refer to extreme or record temperatures as ETs (not extraterrestrials).😉
Main Topic: Using the Extreme Temperature Index to Statistically Judge Friday’s Records
Dear Diary. It’s been a while since I used my Extreme Temperature Index to examine some eye-opening record reports. We saw many of these yesterday. As many of you know, I’d like meteorological statisticians and climatologists to develop the ETI for statistical use so that we can better see how extreme temperatures are affecting the planet. The ETI should be useful during heatwaves, for example, if further developed.
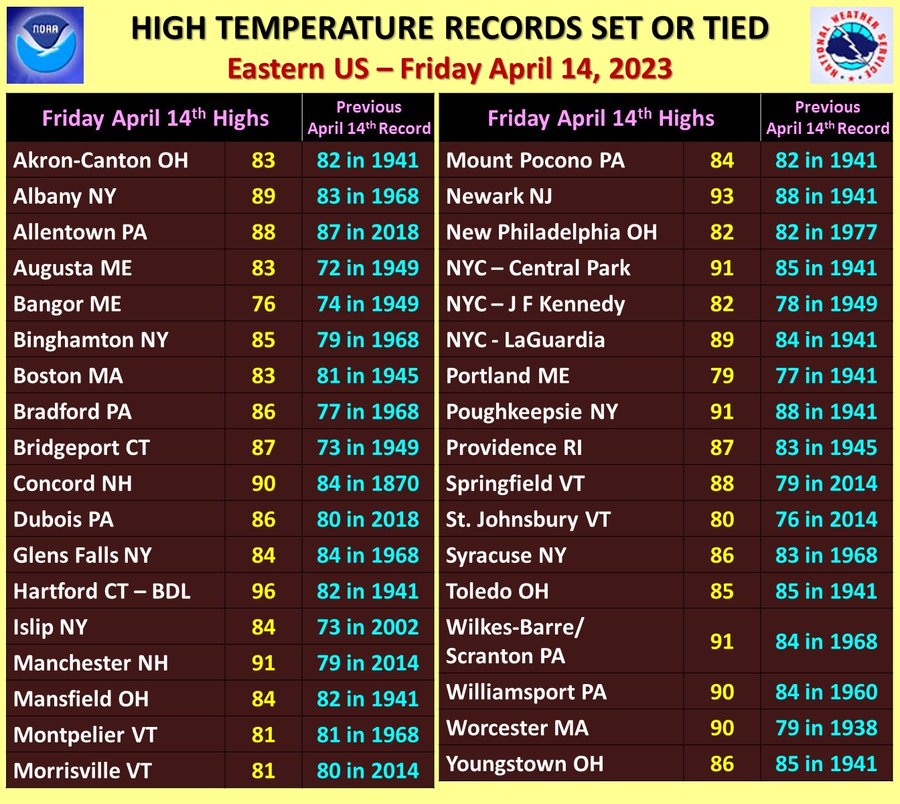
Let’s use the ETI to judge which of the records on this list from Friday is the most significant:
First, the current algorithm and formula for the Extreme Temperature Index are presented here (for the history of the ETI and more on variables factored into the algorithm read:
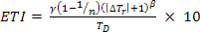
Looking at the current formula, the factor with the heaviest weight would be magnitude of the record, or how many degrees the new record was above or below the old. We only need to pick out new reports with the greatest departure from their old records to determine which are the most significant using the current ETI formula. From the list we see that Bridgeport CT and Hartford CT top the list, breaking their records by a full 14 degrees. Let’s compare these two looking at National Weather Service data:
Bridgeport, CT (BDG):
= 74 (as of 2023)
new record high = 87
previous record high = 73
normal diurnal range for date (4/14) = 58-41= 17
ETI = +[(1 – .014)(14 + 1)/17] x 10 = +8.70
Hartford, CT (BDL):
n = 90 (as of 2023)
new record high = 96 (monthly record)
previous record high = 82
normal diurnal range for date (4/14) = 60-38 = 22
ETI = + [(1 – .011)(14 + 1)/22] x 10 = +6.74
Here we see that the typical diurnal range of Bridgeport was the biggest factor for the ETI, not how toasty Hartford was on Friday or the fact that records have been kept longer at Hartford. Bridgeport is located very close to the coast, so its climatological diurnal range of temperatures is lower than the more inland city of Hartford. Therefore, it is harder for Bridgeport to exceed its diurnal range with a new record than at Hartford. Here we see that the ETI is useful, pegging that Bridgeport had the most significant record compared with Hartford, despite the fact that Hartford took the top prize of getting up to 96°F (35.5°C)
Bridgeport CT had the most significant record on this list using the Extreme Temperature Index.
Of course, there might be more variables, so perhaps someone in the future can take up the mantle of this ETI concept and use it for establishing better science.
Here are some other “ET’s” recorded from around the planet the last couple of days, their consequences, and some extreme temperature outlooks, as well as any extreme precipitation reports:
Here is some more new March 2023 climatology:
Here is more climate and weather news from Saturday.
(As usual, this will be a fluid post in which more information gets added during the day as it crosses my radar, crediting all who have put it on-line. Items will be archived on this site for posterity. In most instances click on the pictures of each tweet to see each article. The most noteworthy items will be listed first.)
If you like these posts and my work please contribute via the PayPal widget, which has recently been added to this site. Thanks in advance for any support.)
Guy Walton… “The Climate Guy”