The main purpose of this ongoing blog will be to track planetary extreme, or record temperatures related to climate change. Any reports I see of ETs will be listed below the main topic of the day. I’ll refer to extreme or record temperatures as ETs (not extraterrestrials).😉
Main Topic: Though Very Hot, The Weather of 2024 Is Not Moving the Needle on U.S. Politics
Dear Diary. I always have to go way back to 2007 when describing weather as just tepid enough to lull Al Gore’s frogs (the public) to sleep on climate as the planet warms due to carbon pollution, or suddenly getting quite hot, enough for the President to declare a climate emergency and America’s populace to try to jump out of a boiling pot with wholescale action. As far as this crucial election of 2024 goes, it’s been hot enough this summer, so far, to close in on the hottest summer on record, which occurred very recently in 2021. However, it has not been hot enough for Al Gore’s frogs to put the climate issue ahead of economics or immigration. Alas, as of mid-July, climate change denying Trump is ahead of Biden by a few percentage points looking at poll averages.
As I mentioned yesterday, the eastern and central U.S. will be getting a big heat break starting Wednesday of this week due to the passage of a front. The weather pattern will return to normality for at least a week thereafter except in the West where above average temperatures will continue, Still, we won’t have any historic heatwaves across the U.S. going into late July; therefore, Al Gore’s frogs won’t be jumping anytime soon. Extreme heat might rear its ugly head in August, though.
That leaves the tropics going into the last few months before the election. Will they be as historically rambunctious as some forecasters are calling for, enough to affect U.S. elections? Stay tuned.
Climate contrarians love to point to the summer of 1936 to state that recent summers are not as hot as some have been in the past, and they would be correct as far as many records are concerned. Average temperatures across the lower 48 states have been hotter than those from the summer of 1936 during certain years, but extreme records from that year still stand. Had those records been widely mowed down this year, I do believe that Al Gore’s frogs would be jumping. I think that this will be occurring sometime during the next decade or two but not during 2024.
Some locations have been experiencing 1930s style record heat, though:
My buddy Bob Henson goes into detail why records from 1936 still stand across the United States. There are other scientific reasons why records got so hot in 1936. Here is his report:
Why were the 1930s so hot in North America? » Yale Climate Connections
Why were the 1930s so hot in North America?
Climate skeptics sometimes point to heat records from that decade to dismiss the reality of global warming. They’re leaving out crucial context.


by BOB HENSON and JEFF MASTERS JULY 15, 2024
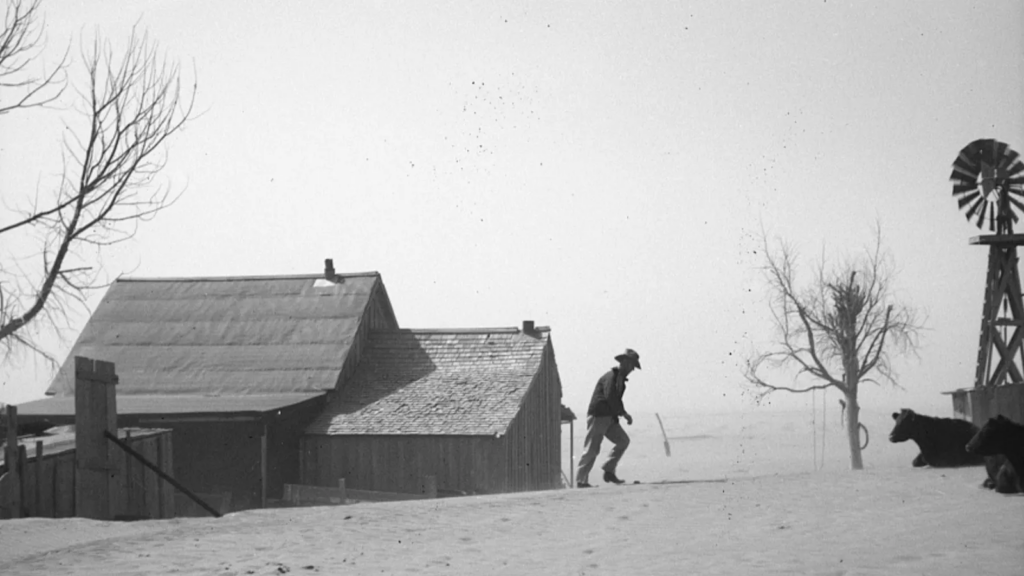
A rancher, most likely in the western Oklahoma Panhandle, trudges onto his barren land in April 1936. Library of Congress
Those who’ve trawled social media during heat waves have likely encountered a tidbit frequently used to brush aside human-caused climate change: Many U.S. states and cities had their single hottest temperature on record during the 1930s, setting incredible heat marks that still stand today.
The critical context that’s typically left out is that the 1930s were the decade of the Dust Bowl — the grim result of relentless overplowing of the Great Plains followed by natural oceanic cycles that favored a multiyear drought, which coincided with the Great Depression. It’s a U.S. disaster almost a century old, one that draws little attention today and whose living memory is fading fast.
The University of Nebraska’s excellent summary of the Dust Bowl points to some of the sociological factors that led to the catastrophe:
“Boosters” of the region, hoping to promote settlement, put forth glowing but inaccurate accounts of the Great Plains’ agricultural potential. In addition to this inaccurate information, most settlers had little money and few other assets, and their farming experience was based on conditions in the more humid eastern United States, so the crops and cultivation practices they chose often were not suitable for the Great Plains. But the earliest settlements occurred during a wet cycle, and the first crops flourished, so settlers were encouraged to continue practices that would later have to be abandoned.
Three multi-year periods of drought unfolded between 1928 and 1942, with virtually no break in between. Much of the topsoil across the central United States simply blew away during those nasty years. The bare landscape allowed for maximal warming from the summer sun, which in turn helped reinforce the deep atmospheric heat that prevailed. Day-to-day weather patterns sometimes pushed the dust and heat all the way to the East Coast.
Hundreds of thousands of destitute farmers made their way from the Great Plains to California in hopes of finding work, a migration immortalized in the acclaimed book and movie “The Grapes of Wrath.” [From Bob Henson: My own mother grew up in western Oklahoma during the Dust Bowl, and I vividly remember her telling me how she sometimes walked to school with a wet handkerchief over her face, simply to be able to breathe without inhaling lungfuls of dust.]
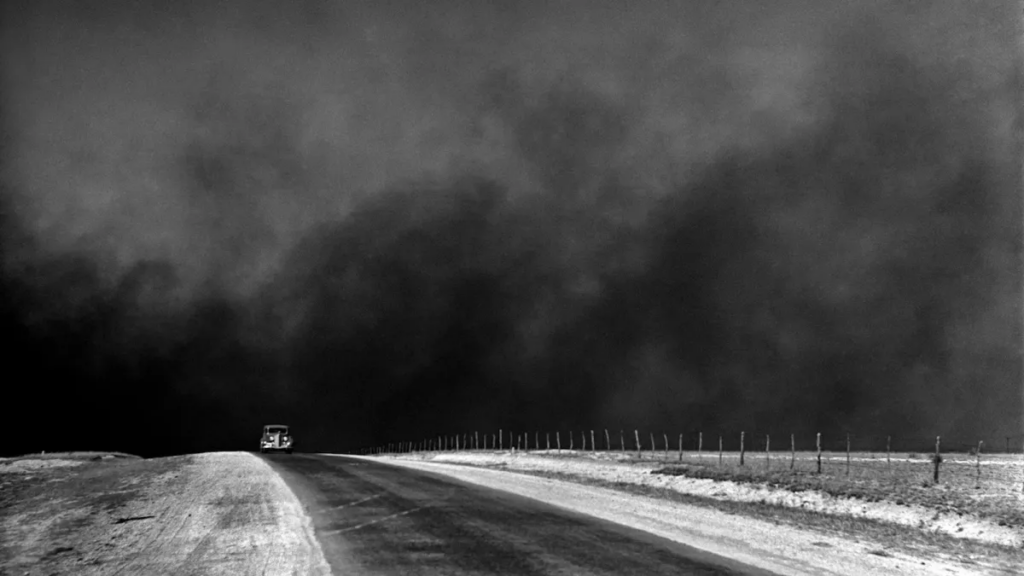
Figure 1. An unidentified car on a road in the Texas Panhandle in March 1936 with heavy clouds of dust in the sky — a typical phenomenon of the Dust Bowl. (Image credit: Library of Congress, via Wikimedia Commons)
How the Dust Bowl teamed up with natural oceanic cycles to create all-time record heat
There’s ample evidence that the heat of the 1930s was partially the result of the parched landscape that itself was stoked by overeager planting and plowing.
Richard Seager of Columbia University and colleagues found through computer modeling that the landscape degradation of the Dust Bowl interacted with an ocean-forced drought, intensifying the hot pattern and shifting it poleward. And a 2022 modeling study led by Gerald Meehl of the National Center for Atmospheric Research found that the Dust Bowl landscape may have helped to propagate heat extremes across other parts of the Northern Hemisphere. That paper notes:
It has only been in the twenty-first century that human populations in these regions of the Northern Hemisphere have experienced heat extremes comparable to the 1930s. This demonstrates that humans influenced Northern Hemisphere temperature and heat extremes through disastrous and unprecedented regional land use practices over the Great Plains, and points to the possibility that future intense regional droughts could affect heat extremes on hemispheric scales.
Even with the Dust Bowl influence having potentially helped spread heat and drought from North America as far as Eurasia, most of the planet remained significantly cooler than today. When you compare global and U.S. temperatures from the 1930s versus the early 21st century, as done in a Climate Brink post by scientist Andrew Dessler (see Fig. 3 below), it’s obvious that the United States wasn’t part of a truly global heat trend back then, whereas it certainly is now.
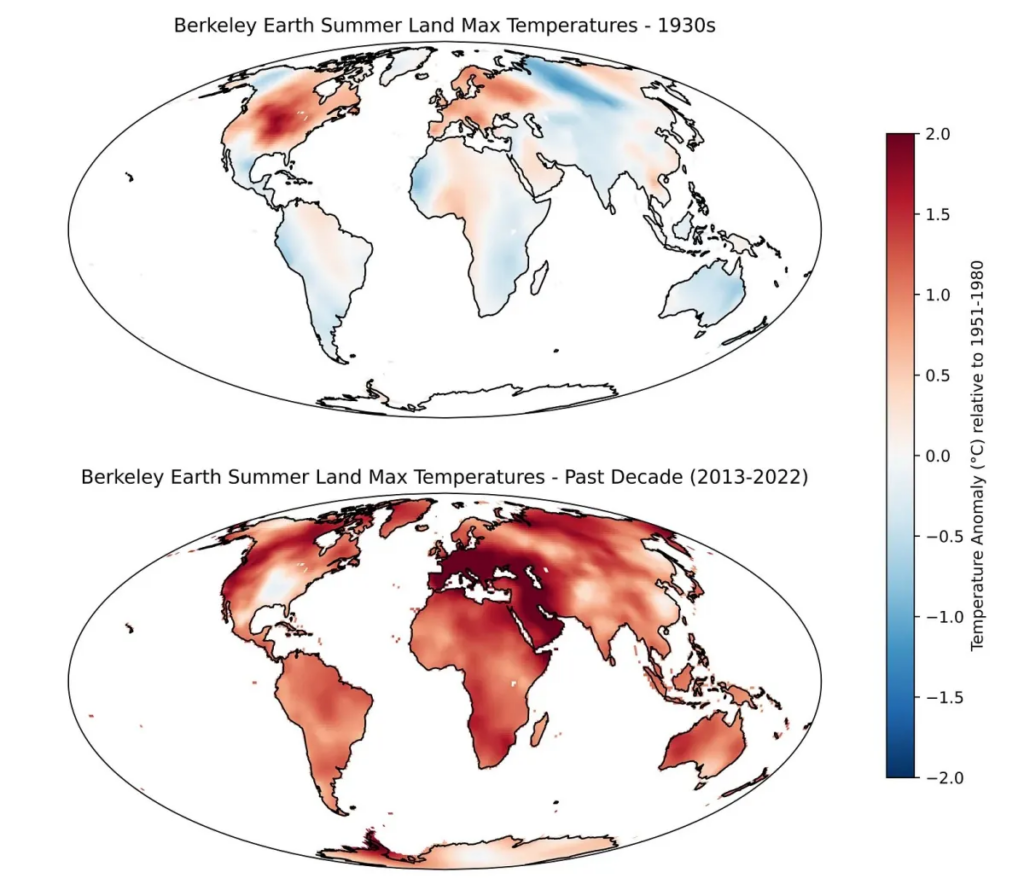
Figure 3. Average summer high temperatures over land-based areas in the 1930s (top) and in the decade 2013-2022 (bottom). (Image credit: Andrew Dessler/Climate Brink, data from Berkeley Earth)
If anything, the 1930s aren’t a comforting tale of natural variability so much as a cautionary tale of what can happen — a saga of hubris, and of ignorance of how human interaction with the natural environment can pave the way to far-reaching climate impacts.
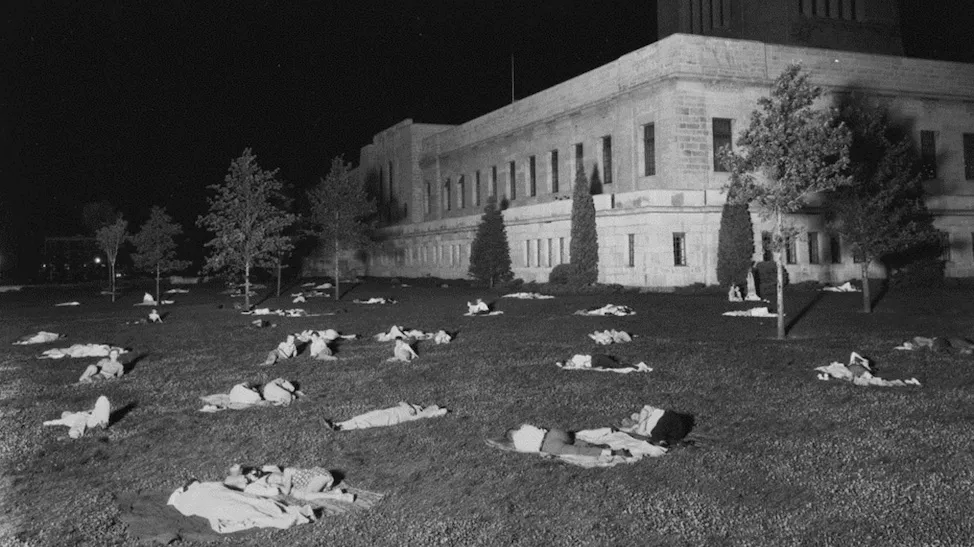
Figure 2. The lawn of the newly completed Nebraska State Capitol provided a resting place for Lincoln residents trying to escape the heat in July 1936, near the peak of the 1930s Dust Bowl. Lincoln’s hottest daily minimum on record and its all-time high both occurred on July 25, 1936, with 91°F and 115°F, respectively. (Image credit: History Nebraska Collections)
1936 heat records
The heat was especially brutal during July and August 1936, as chronicled in detail by extreme weather historian Christopher Burt in a 2018 write-up at Weather Underground. Dozens of U.S. states and cities set all-time high temperatures (i.e., the highest readings ever officially observed at a given site). The heat extended into south-central Canada, where Winnipeg, Manitoba, soared to its still-standing all-time high of 108 degrees Fahrenheit. Below are a few of the still-standing all-time highs set or tied in July 1936 at major U.S. cities:
New York City, New York: 106°F (July 10)
Baltimore, Maryland: 107°F (July 10)
Columbus, Ohio: 106°F (July 14)
Louisville, Kentucky: 107°F (July 14)
Des Moines, Iowa: 110°F (July 25)
Minneapolis, Minnesota: 108°F (July 14)
Bismarck, North Dakota: 114°F (July 6)
Omaha, Nebraska: 114°F (July 25)
The following states also set all-time highs in July 1936, each of which stands today:
Indiana: 116°F (Collegeville, July 14)
Iowa*: 117°F (Atlantic and Logan, July 25)
Kansas: 121°F (Fredonia, July 18, and Alton, July 24)
Maryland: 109°F (Cumberland and Frederick, July 10)
Michigan: 112°F (Mio, July 13)
Minnesota: 114°F (Moorhead, July 6)
Missouri: 118°F (Clinton, July 15, and Lamar, July 18)
Nebraska: 118°F (Hartington, July 17, and Minden, July 24)
New Jersey: 110°F (Runyon, July 10)
North Dakota: 121°F (Steele, July 6)
Oklahoma: 120°F (Alva, July 18, and Altus, July 19)
Pennsylvania: 111°F (Phoenixville, July 10)
West Virginia: 112°F (Martinsburg, July 10)
Wisconsin: 114°F (Wisconsin Dells, July 13)
*The 118°F reported from Keokuk 2 on July 20, 1934, is almost certainly false. No other site in Iowa measured above 112°F that day, and the NWS Keokuk site measured just 109°F.
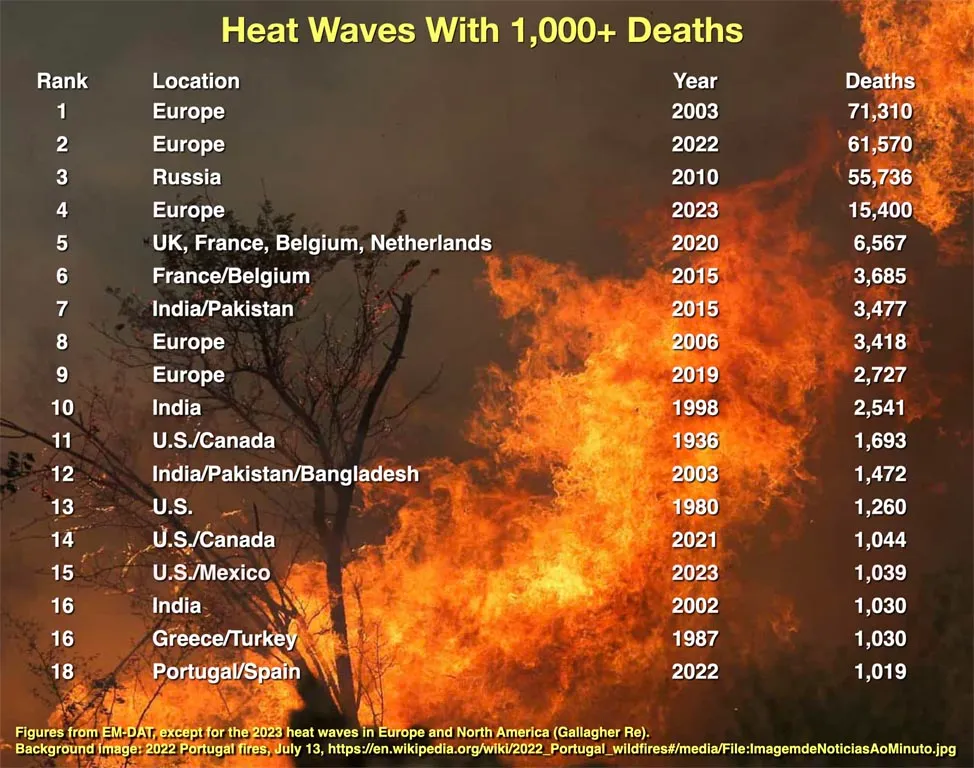
The international disasters database EM-DAT lists the North American heat wave of 1936 as the 11th-deadliest in modern world history, with 1,693 deaths. However, that total is an underestimate, as it includes only deaths reported from Illinois in July (1,193) and an estimated 500 deaths in Canada. Burt notes that press reports from St. Louis, Minneapolis, and Indiana imply another 814 heat-related fatalities in those locations alone. A Department of Commerce mortality statistics summary (see PDF file) lists 4,678 U.S. deaths attributed to excessive heat in 1936, as compared to 728 in 1935.
As Burt put it:
… nothing comparable to the heat wave(s) of the summer of 1936 has before or since occurred in the contiguous U.S. It is hard to imagine how people fared without home air conditioning, although there were some rudimentary forms available, such as swamp coolers. Movie theaters were one of the few places where air conditioning provided at least some temporary relief.
We help millions of people understand climate change and what to do about it. Help us reach even more people like you.

BOB HENSON
Bob Henson is a meteorologist and journalist based in Boulder, Colorado. He has written on weather and climate for the National Center for Atmospheric Research, Weather Underground, and many freelance… More by Bob Henson

JEFF MASTERS
Jeff Masters, Ph.D., worked as a hurricane scientist with the NOAA Hurricane Hunters from 1986-1990. After a near-fatal flight into category 5 Hurricane Hugo, he left the Hurricane Hunters to pursue a… More by Jeff Masters
Bob Henson’s and Dr. Jeff Master’s Why were the 1930s so hot in North America? was first published on Yale Climate Connections, a program of the Yale School of the Environment, available at: http://yaleclimateconnections.org. This work is licensed under a Creative Commons Attribution-Noncommercial-No Derivative Works 2.5 license (CC BY-NC-ND 2.5).
Here are more “ETs” recorded from around the planet the last couple of days, their consequences, and some extreme temperature outlooks, as well as any extreme precipitation reports:
Here is some more June 2024 climatology (Prior reports are listed on older daily diary blogs for each calendar day.):
Here is More Climate News from Tuesday:
(As usual, this will be a fluid post in which more information gets added during the day as it crosses my radar, crediting all who have put it on-line. Items will be archived on this site for posterity. In most instances click on the pictures of each tweet to see each article. The most noteworthy items will be listed first.)