The main purpose of this ongoing blog is to track planetary extreme, or record temperatures related to climate change. Any reports I see of ETs will be listed below the main topic of the day. I’ll refer to extreme or record temperatures as ETs (not extraterrestrials).😉
Main Topic: Bad News Concerning Emissions and the Clouds Tipping Point
Dear Diary. One thing that climatologists fear is how tipping points could effect further methane emissions. A new article suggests that by 2035 trends in association with our carbon emissions could effect worldwide clouds such that global warmth will spike even further. It’s not good news for a world struggling to transition from a carbon-based energy system to one run by renewables.
For science geeks, this one is right up your alley (for many more charts and links that I did not copy, hit the following link):
Arctic News: Carbon dioxide growing rapidly (arctic-news.blogspot.com)
Thursday, August 22, 2024
Carbon dioxide growing rapidly
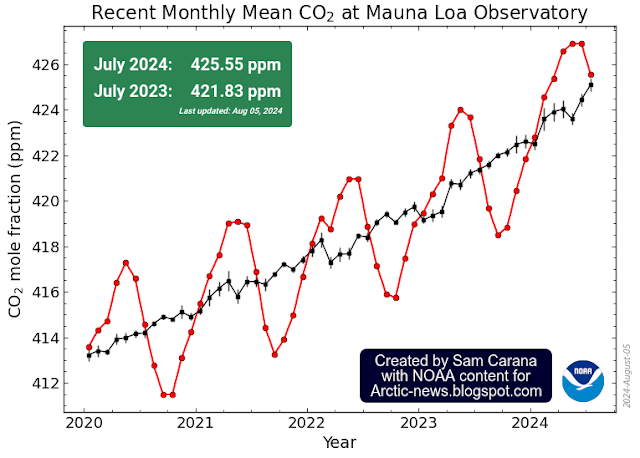
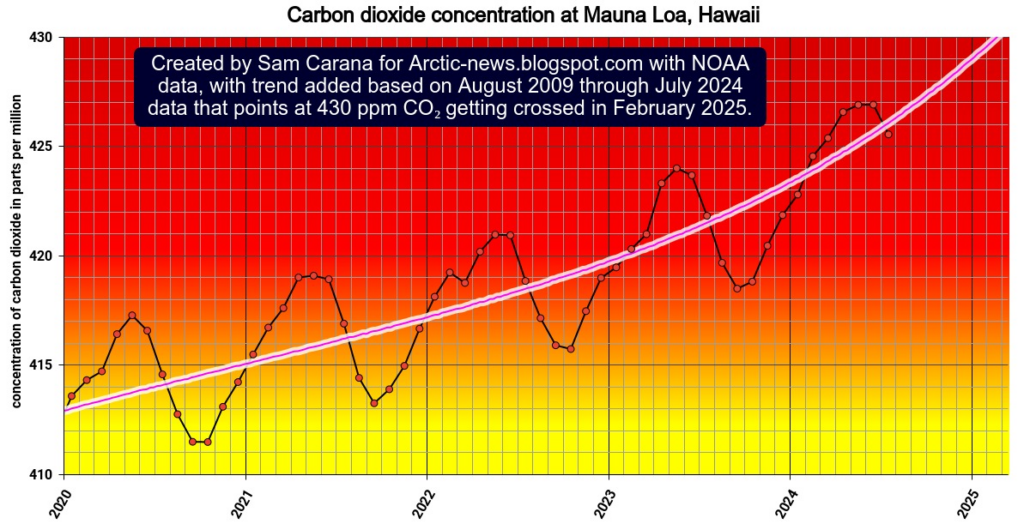
The image below shows NOAA monthly mean concentration of carbon dioxide (CO₂) recorded at Mauna Loa, Hawaii, from 2020 through July 2024. The inset shows that CO₂ was 425.55 parts per million (ppm) in July 2024, an increase of 3.72 ppm from July 2023, when CO₂ was 421.83 ppm. This 3.72 ppm growth is higher than the 3.36 ppm annual growth in 2023, the highest annual growth on record.
The image below shows the same data, with a trend added based on August 2009 through July 2024 data.
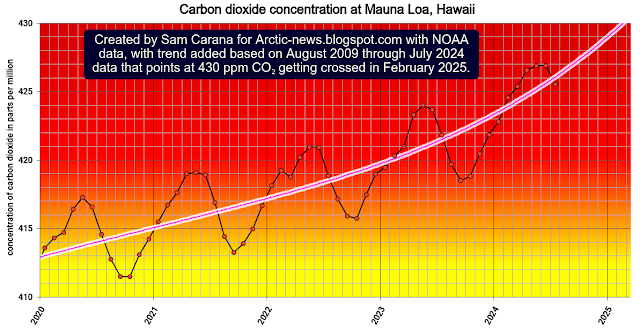
The above trend points at 430 ppm CO₂ getting crossed in February 2025, which would constitute a jump of 10 ppm in two years time (from 420 ppm in February 2023 to 430 ppm in February 2025). Despite numerous warnings and despite politicians’ pledges to act decisively, the concentration of CO₂ in the atmosphere is growing rapidly.
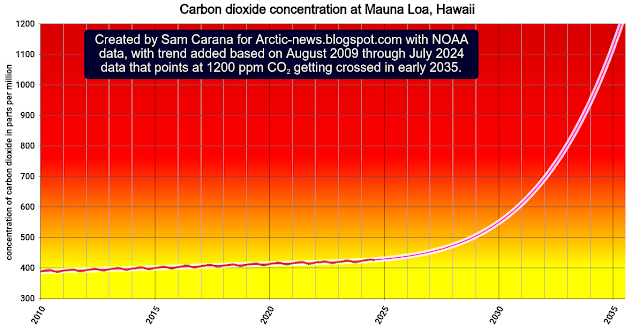
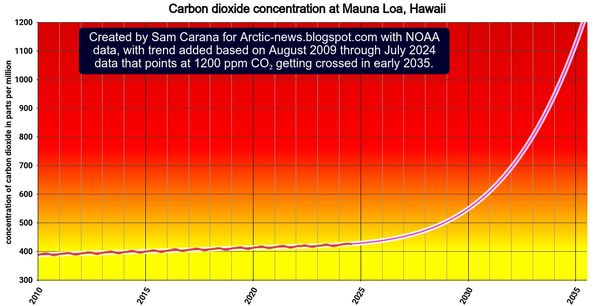
If this trend continues, 1200 ppm CO₂ could be crossed in early 2035, as illustrated by the image below.
The above trend points at 430 ppm CO₂ getting crossed in February 2025, which would constitute a jump of 10 ppm in two years time (from 420 ppm in February 2023 to 430 ppm in February 2025). Despite numerous warnings and despite politicians’ pledges to act decisively, the concentration of CO₂ in the atmosphere is growing rapidly.
If this trend continues, 1200 ppm CO₂ could be crossed in early 2035, as illustrated by the image below.

In other words, the clouds tipping point could get crossed in early 2035 due to the rise in CO₂ alone.
from earlier post
Rising emissions could originate from many sources, the more so as more sinks turn into sources.
[ from earlier post ]
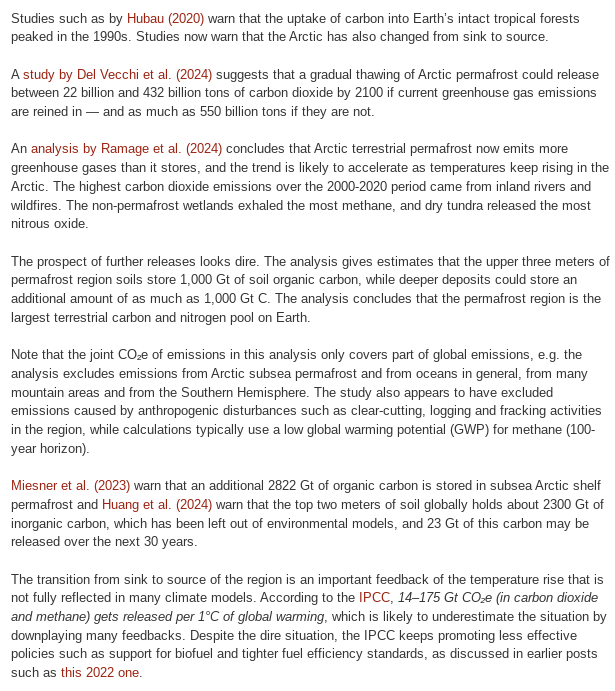
The clouds tipping point is at 1200 ppm CO₂e (carbon dioxide equivalent), so it could be crossed even earlier than in 2035 when also taking into account more methane, nitrous oxide, etc. As illustrated by the above image, from an earlier post, a trend added to NOAA globally averaged marine surface monthly mean methane data from April 2018 to November 2022 points at 1200 ppm CO₂e – at a Global Warming Potential (GWP) of 200 – getting crossed in 2027 due to a rise in methane alone.
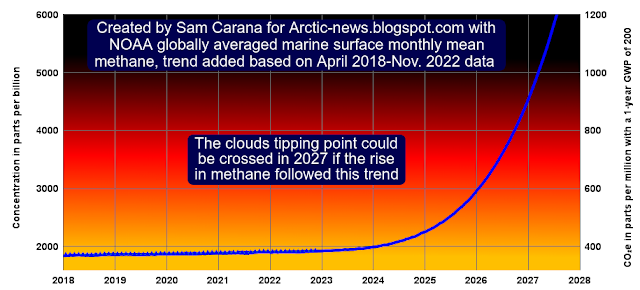
The above image, adapted from Copernicus, shows a methane forecast for August 22, 2024 03 UTC (run 00 UTC). Note that the scale goes up to 10 ppm or 10,000 parts per billion (ppb).

The above image shows that high methane concentrations (around 2400 ppb) were recently recorded at the observatory in Utqiagvik (Barrow), Alaska.
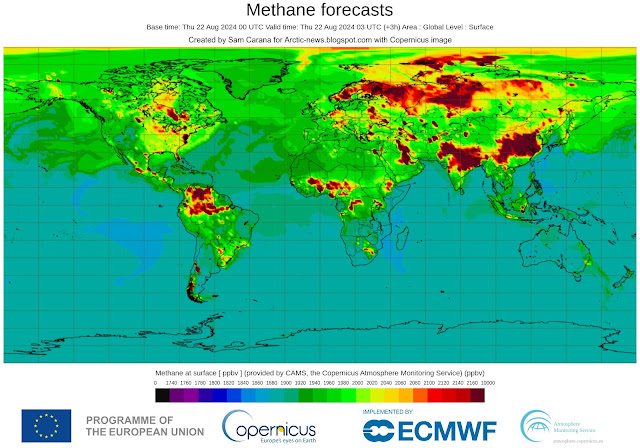
As discussed in an earlier post, peak daily average methane is approaching 2000 ppb at Mauna Loa, Hawaii. Local peaks can be much higher, as illustrated by the image on the right that shows that a methane peak of 2739 ppb was recorded at 399 mb by the NOAA 20 satellite on August 22, 2024 AM.
Methane levels are particularly high at latitudes higher than 60°N, where they can often exceed 2000 ppb, even at relatively low altitudes.
The next image shows methane as recorded by the NOAA 20 satellite on August 13, 2024 AM at 1000 mb, which corresponds with the lowest altitude available.

The next image shows methane on August 23, 2024 AM at 840 mb, where the NOAA 20 satellite recorded levels as high as 2418 ppb.

When using a Global Warming Potential (GWP) of 200 for methane, a concentration of 2000 ppb corresponds with 400 ppm CO₂e. Together with a daily peak CO₂ concentration of 430 ppm, this adds up to a joint CO₂e of 830 ppm, i.e. only 370 ppm away from the clouds tipping point at 1200 ppm CO₂e. This 370 ppm CO₂e could be added almost instantly by a burst of seafloor methane less than the size of the methane that is currently in the atmosphere (about 5 Gt).
There is plenty of potential for such an abrupt release, given the rising ocean heat and the vast amounts of carbon and methane contained in vulnerable sediments at the seafloor of the Arctic Ocean, as discussed above and in earlier posts such as this one, and at the threat page.
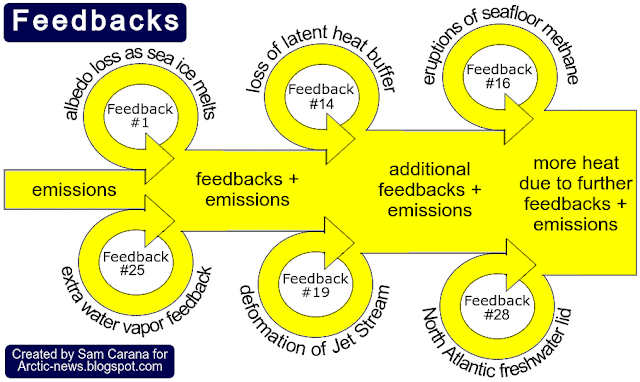
There are further emissions and developments such as tipping points and feedbacks that should be taken into account. The above image, from an earlier post, illustrates the mechanism how multiple feedbacks can accelerate the temperature rise of the atmosphere.Several feedbacks can also constitute tipping points. Decline of Arctic sea ice comes with loss of albedo and loss of the Latent Heat Buffer, and the joint loss can abruptly and dramatically increase temperatures in the Arctic Ocean.Further increase of heat in the Arctic Ocean can in turn cause the Seafloor Methane Tipping Point to get crossed, resulting in destabilization of methane hydrates contained in sediments at the seafloor of the Arctic Ocean, as discussed in many earlier posts such as this one.
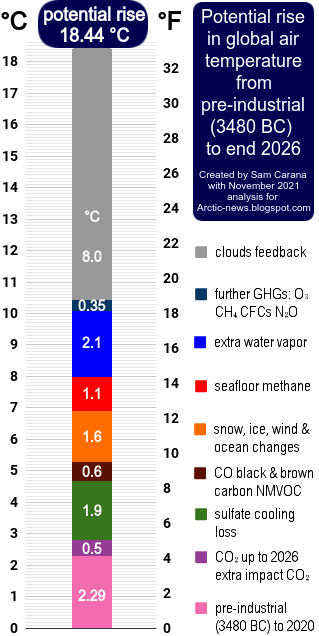
Self-amplifying feedbacks and crossing of tipping points, as well as further developments (such a as loss of the aerosol masking effect and sunspots reaching a peak) could all contribute to cause a temperature rise from pre-industrial of over 10°C, in the process causing the clouds tipping point to get crossed that can push up the temperature rise by a further 8°C.
Altogether, the temperature rise may exceed 18°C from pre-industrial by 2026, as illustrated by the following image:
Climate Emergency Declaration The situation is dire and the precautionary principle calls for rapid, comprehensive and effective action to reduce the damage and to improve the situation, as described in this 2022 post, where needed in combination with a Climate Emergency Declaration, as discussed at this group.

Links
• NOAA – Global Monitoring Laboratory – Carbon Cycle Gases, trends in CO2
https://gml.noaa.gov/ccgg/trends
• NOAA – Global Monitoring Laboratory – Carbon Cycle Gases, Mauna Loa, Hawaii, U.S.
https://gml.noaa.gov/dv/iadv/graph.php?code=MLO&program=ccgg&type=ts
• Copernicus – methane forecasts
https://atmosphere.copernicus.eu/charts/packages/cams/products/methane-forecasts
• The Clouds Feedback and the Clouds Tipping Point
https://arctic-news.blogspot.com/p/clouds-feedback.html
• Albedo
https://arctic-news.blogspot.com/p/albedo.html
• Feedbacks in the Arctic
https://arctic-news.blogspot.com/p/feedbacks.html
Jet Stream
https://arctic-news.blogspot.com/p/jet-stream.html
• Latent Heat
https://arctic-news.blogspot.com/p/latent-heat.html
• Cold freshwater lid on North Atlantic
https://arctic-news.blogspot.com/p/cold-freshwater-lid-on-north-atlantic.html
• Sunspots
https://arctic-news.blogspot.com/p/sunspots.html
• Pre-industrial
https://arctic-news.blogspot.com/p/pre-industrial.html
• Extinction
https://arctic-news.blogspot.com/p/extinction.html
• Transforming Society
https://arctic-news.blogspot.com/2022/10/transforming-society.html
Climate Plan
https://arctic-news.blogspot.com/p/climateplan.html
• Climate Emergency Declaration
https://arctic-news.blogspot.com/p/climate-emergency-declaration.html
Sam Carana
CARBON DIOXIDE GROWING RAPIDLY
The top image shows NOAA monthly mean concentration of carbon dioxide (CO₂) recorded at Mauna Loa, Hawaii, from 2020 through July 2024, with a trend added based on August 2009 through July 2024 data.
The trend points at 430 ppm CO₂ getting crossed in February 2025, a jump of 10 ppm in two years time (from 420 ppm in February 2023 to 430 ppm in February 2025).
Despite numerous warnings and despite politicians’ pledges to act decisively, the concentration of CO₂ in the atmosphere is growing rapidly.
If this trend continues, 1200 ppm CO₂ could be crossed in early 2035, as illustrated by the second image.
The clouds tipping point is at 1200 ppm CO₂e (carbon dioxide equivalent), so it could be crossed even earlier than in 2035 when also taking into account more methane, nitrous oxide, etc. As illustrated by an earlier image, a trend points at 1200 ppm CO₂e getting crossed in 2027 due to a rise in methane alone.
As discussed earlier, peak daily average methane is approaching 2000 parts per billion (ppb) at Mauna Loa, Hawaii. A methane concentration of 2000 ppb corresponds – at a Global Warming Potential (GWP) of 200 – with 400 ppm CO₂e. Together with a daily peak CO₂ concentration of 430 ppm, this adds up to a joint CO₂e of 830 ppm, i.e. only 370 ppm away from the clouds tipping point.
This 370 ppm CO₂e could be added almost instantly by a burst of seafloor methane less than the size of the methane that is currently in the atmosphere (about 5 Gt). There is plenty of potential for such an abrupt release, given the rising ocean heat and the vast amounts of carbon and methane contained in vulnerable sediments at the seafloor of the Arctic Ocean.
There are further emissions and developments that should be taken into account. Self-amplifying feedbacks and crossing of tipping points, and developments such a as loss of the aerosol masking effect and sunspots reaching a peak could all contribute to cause a temperature rise from pre-industrial of over 10°C, in the process causing the clouds tipping point to get crossed that can push up the temperature rise by a further 8°C. Altogether, the temperature rise may exceed 18°C from pre-industrial by 2026.
From the post ‘Carbon dioxide growing rapidly’, at: https://arctic-news.blogspot.com/…/carbon-dioxide…
Posted by Sam Carana at 4:27 AM
Labels: carbon dioxide, feedbacks, methane, tipping point
Here are more “ETs” recorded from around the planet the last couple of days, their consequences, and some extreme temperature outlooks, as well as any extreme precipitation reports:
Here is More Climate News from Tuesday:
(As usual, this will be a fluid post in which more information gets added during the day as it crosses my radar, crediting all who have put it on-line. Items will be archived on this site for posterity. In most instances click on the pictures of each tweet to see each article. The most noteworthy items will be listed first.)