The main purpose of this ongoing blog will be to track planetary extreme, or record temperatures related to climate change. Any reports I see of ETs will be listed below the main topic of the day. I’ll refer to extreme or record temperatures as ETs (not extraterrestrials).😉
Main Topic: U.S. January 2025 Record Scoreboard and Climatological Review
January 2025 using 1901-2000 mean data got ranked by the National Center for Environmental Information for the lower 48 states as 99th warmest or 33rd coolest since records began being kept in 1895 at -0.89°F below average.
The above data was from:
https://www.ncdc.noaa.gov/cag/national/rankings
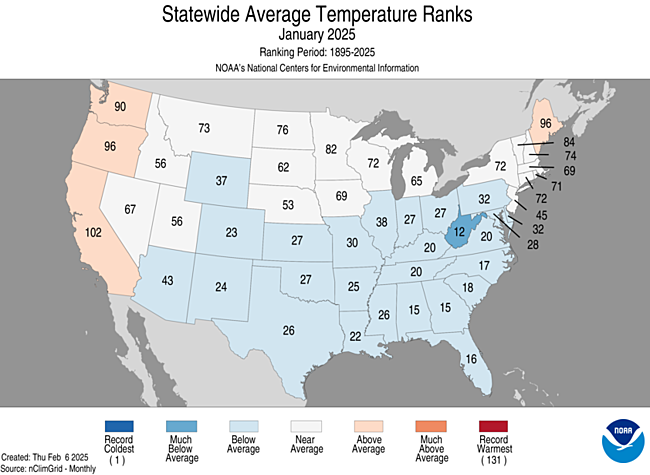
During January 2025 well below average warmth occurred for most of the country except for the west coastal states, Alaska, and Maine. Most reports of record warmth came from the western half of the nation throughout the month. Most reports of record chill came from the South due to a historic Arctic outbreak early in the month. It was cold enough for 23 all-time cold records to be recorded.
You can check out record totals for yourself on my NCEI record archives:
NCEI Record Count Archive – Guy On Climate
Here are my two U.S. Daily Record Scoreboards updated through 2/10/2025 (data compiled from the following NCEI site):
https://www.ncdc.noaa.gov/cdo-web/datatools/records
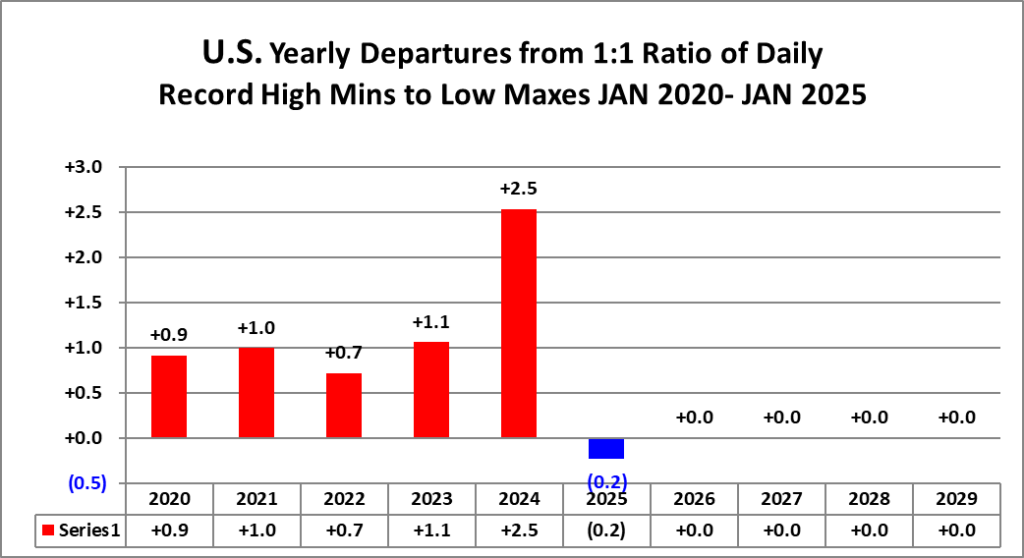
I’m also keeping tabs on record report totals to verify a scientific study I helped to complete in the decade of the 2000s. We’ll eventually see how skewed ratios of record warm to cold reports get by the year 2100, which the study mentions as 50-1 for DHMX vs. DLMN:
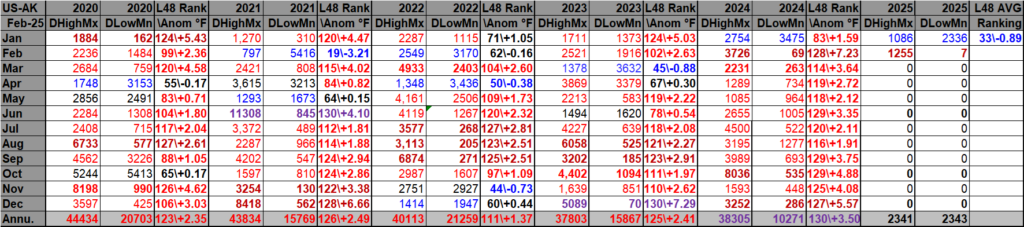
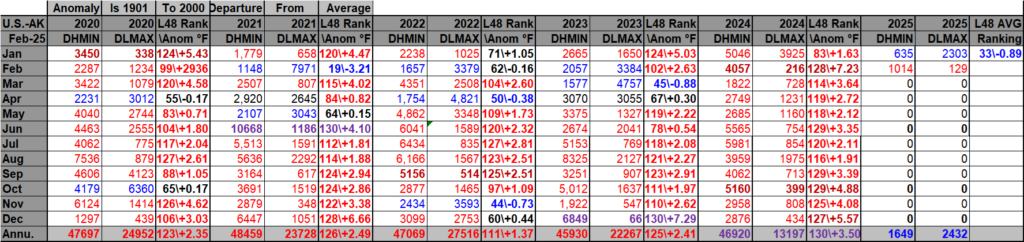
DHMX= Daily High Max Reports. DLMN= Daily Low Min Reports. DHMN= Daily High Min Reports. DLMX=Daily Low Max Reports.
Boldly highlighted red, blue, or purple colored months, such as December 2023 and June 2021, that have ratios of >10 to 1 daily or <1 to 10 of daily warm to low records are either historically hot or cold, most of which have made news. NCEI rankings are for the lower 48 states with the warmest ranking since 1895 of average temperatures being 130 and 1 being the coldest as of 2024. Blue colors represent cold months and red warm. Those months and years with counts close to a 1 to 1 ratio of highs to lows are colored black. All-time record hottest or coldest months and years are boldly colored in purple. NCDC rankings have been color coded (under tabs in each file) such that values of 54 to 74 are black representing neutral months or years (+ or – 10 from the average ranking of 64).
Totals are record reports for the entire United States including all territories minus those from Alaska. I’ve subtracted those from Alaska to get a better representation of what has occurred across the lower 48 states in association with lower 48 state rankings.
January 2025 had approximately a 5 to 12 ratio of record DHMX to DLMN individual record counts, so the color I used for that month was blue on the top chart.
January 2025 had approximately a 1 to 4 ratio of record DHMN to DLMX individual record counts, so the color I used for that month was blue on the bottom chart.
Due to climate change, we are seeing fewer blue colors on these Record Scoreboards with time.
The average temperature lower 48 state ranking for January 2025 was 33, which was colored blue since it was colder than average. We are seeing fewer blue colors on my charts, but January 2025 was an exception similar to January 2024, the last below average blue month.
I color rankings of +10 to -10 from the average ranking for the lower 48 states of 65 black, indicating that these are near average temperature wise. The top warmest ranking for 2024 would be 130 since rankings began in 1895.
Looking at the type and number of record reports, February 2025 has gotten off to a warm start with most record warmth ending as of today February 10th. More Arctic outbreaks will chill the northern sections of the country through the remainder of the month, but these won’t be that historically noteworthy. February 2025 will probably be a slightly above average month temperature wise looking at meteorological models, with the South remaining warm and the Midwest chillier than average.
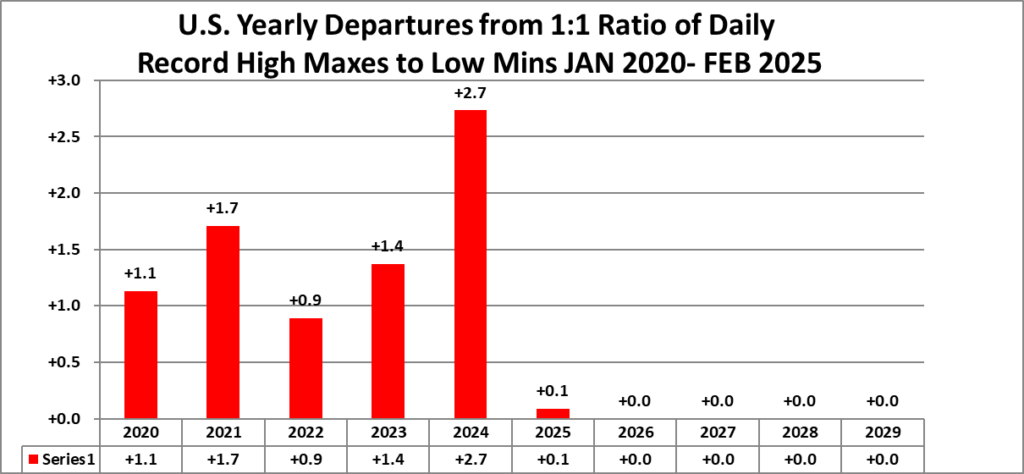
Interestingly, overall ratios for 2024 were higher than historic yearly ratios for other years from the 2020s as shown here…which is no surprise given how hot the globe was during this record hot year thanks to climate change:
Here is much more detailed climatology for the January 2025 as complied by NOAA:
https://www.ncei.noaa.gov/news/national-climate-202501
Assessing the U.S. Climate in January 2025
Destructive California wildfires fueled by strong Santa Ana winds in January; an Arctic blast brought a blanket of snowfall to the Gulf Coast states
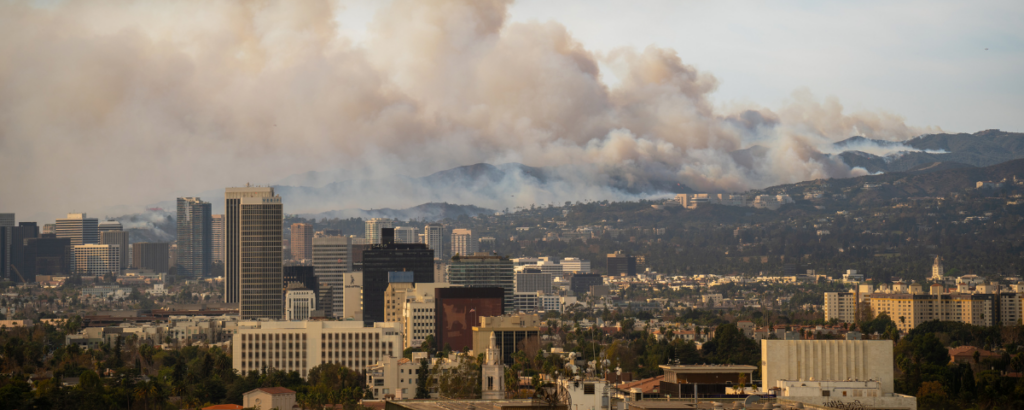
Courtesy of GettyImages. Credit: Erick Ley.
Published
February 10, 2025
Related Links
January 2025 U.S. Climate Report (Available February 13, 2025)
National Temperature and Precipitation Maps
Climatological Rankings Explained
State of the Climate Summaries
Key Points:
- The Palisades and Eaton wildfires in southern California destroyed more than 16,000 structures near Los Angeles and were responsible for at least 29 fatalities. Dry conditions and near-hurricane-force Santa Ana winds contributed to the rapid spread of the fires during January.
- The coldest Arctic airmass of the season-to-date plunged as far south as southern Florida the week of January 19. Larger snowfall amounts ranged from six inches in eastern Texas to record amounts of 10 inches in parts of the Florida Panhandle, as well as more than 10 inches in Lafayette, Louisiana.
- January 2025 was the coldest January since 1988 and sixth driest on record for the nation.
Other Highlights:
Temperature
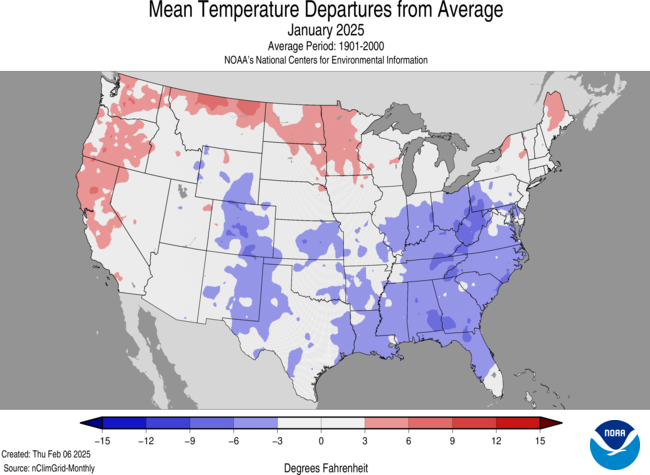
The average temperature of the contiguous U.S. in January was 29.2°F, 0.9°F below average, ranking in the coolest third of the 131-year record and the coldest January on record (2005–25) for the U.S. Climate Reference Network (USCRN). Generally, January temperatures were below average from the central and southern Rockies to the Mid-Atlantic and Southeast. Above-average temperatures were present across parts of the West Coast, Northern Tier and Northeast.
The Alaska statewide January temperature was 15.4°F, 13.2°F above the long-term average, ranking eighth warmest in the 101-year period of record for the state. Above- to much-above average temperatures dominated the state during January.
For January, Hawaiʻi had an average temperature of 64.1°F, 0.7°F above the 1991–2020 average, ranking in the middle third of the 35-year record.
Precipitation

January precipitation for the contiguous U.S. was 1.39 inches, 0.92 inch below average, ranking as the sixth-driest January in the historical record. Precipitation was below average across much of the West and from the northern Plains to the Northeast and across portions of the Southeast. Pockets of above-average precipitation were present across the Rockies as well as portions of the central and southern Plains.
Alaska’s average monthly precipitation ranked wettest on record for January, exceeding the record set in 1949. Much of this precipitation fell as rain throughout the month with three to five times the average amount falling across much of the region from southwest Alaska northeastward to the eastern Brooks Range.
Precipitation across Hawaiʻi in January averaged 6.09 inches, 0.98 inch above average, ranking in the wettest third of the 1991–2025 record.
Drought
According to the February 4 U.S. Drought Monitor report, about 42.4% of the contiguous U.S. was in drought, up about 4.3% from the end of December. Drought conditions expanded or intensified across much of the Southwest and parts of southcentral Texas, as well as in portions of the Carolinas. Drought contracted or was reduced in intensity across parts of the northern Rockies and Hawaiʻi.
Monthly Outlook
Above-average temperatures are favored to impact northern portions of the Southwest and Southeast while precipitation is likely to be above average across portions of the West and Great Lakes. Drought is likely to persist or expand across parts of the central and northern Plains, East Coast and from the Southwest to the Deep South. Visit the Climate Prediction Center’s Official 30-Day Forecasts and U.S. Monthly Drought Outlook website for more details.
Significant wildland fire potential for February is above normal across southern California, the Deep South and Southeast. For additional information on wildland fire potential, visit the National Interagency Fire Center’s One-Month Wildland Fire Outlook.
For more detailed climate information, check out our comprehensive January 2025 U.S. Climate Report scheduled for release on February 13, 2025. For additional information on the statistics provided here, visit the Climate at a Glance and National Maps webpages.
Here are more “ETs” recorded from around the planet the last couple of days, their consequences, and some extreme temperature outlooks, as well as any extreme precipitation reports:
Here is some new January 2025 climatology (More reports are archived on prior daily February 2025 posts.):
Here is More Climate News from Monday:
(As usual, this will be a fluid post in which more information gets added during the day as it crosses my radar, crediting all who have put it on-line. Items will be archived on this site for posterity. In most instances click on the pictures of each tweet to see each article. The most noteworthy items will be listed first.)