The main purpose of this ongoing blog will be to track planetary extreme, or record temperatures related to climate change. Any reports I see of ETs will be listed below the main topic of the day. I’ll refer to extreme or record temperatures as ETs (not extraterrestrials).😉
Main Topic: U.S. March 2025 Record Scoreboard and Climatological Review
Dear Diary. It’s time for our monthly climatological review. Here on this site, we usually present monthly summaries near the 10th of each month, and each is available by clicking the link below:
https://guyonclimate.com/category/record-scoreboard-climatological-reviews
I’m repeating this mantra every month:
March 2025 using 1901-2000 mean data got ranked by the National Center for Environmental Information for the lower 48 states as 6th warmest or 126th coolest since records began being kept in 1895 at +5.4°F above the 1901-2000 average.
The above data was from:
https://www.ncdc.noaa.gov/cag/national/rankings
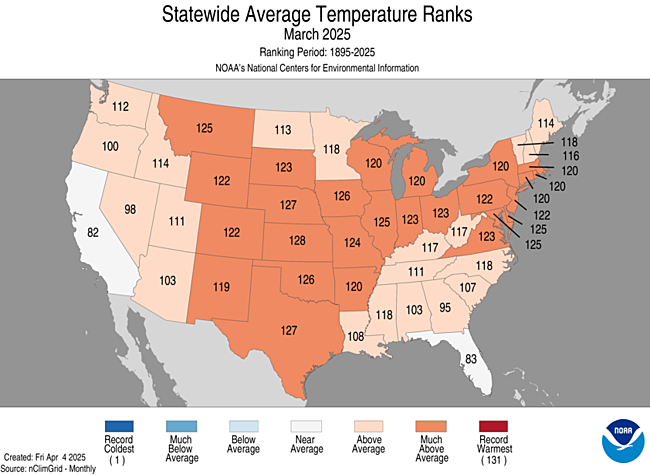
During March there was well above average temperatures for most of the country. Only California and Florida had near average temperatures. Most reports of record chill came from the far West early in the middle of the month. Most reports of record warmth occurred early and late in the month and came from the West, Midwest states and Northeast States.
You can check out record totals for yourself on my NCEI record archives:
NCEI Record Count Archive – Guy On Climate
Here are my two U.S. Daily Record Scoreboards updated through 2/10/2025 (data compiled from the following NCEI site):
https://www.ncdc.noaa.gov/cdo-web/datatools/records
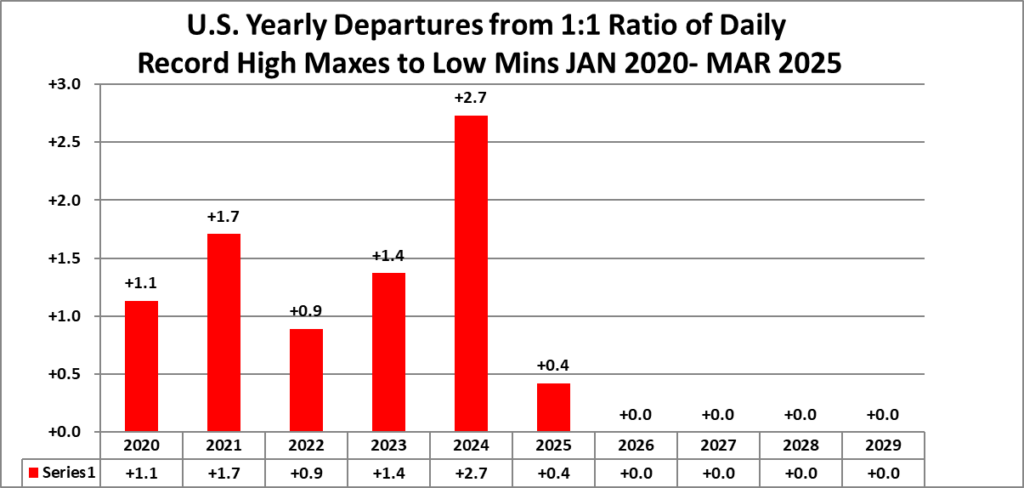
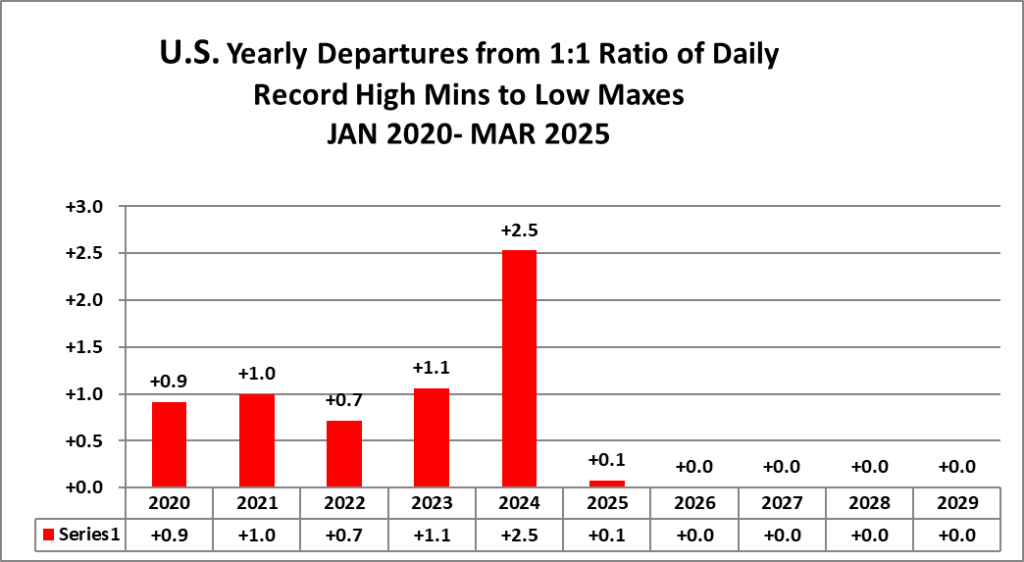
I’m also keeping tabs on record report totals to verify a scientific study I helped to complete in the decade of the 2000s. We’ll eventually see how skewed ratios of record warm to cold reports get by the year 2100, which the study mentions as 50-1 for DHMX vs. DLMN:
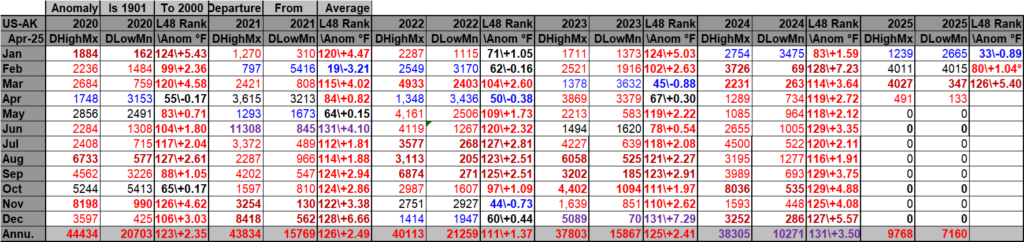
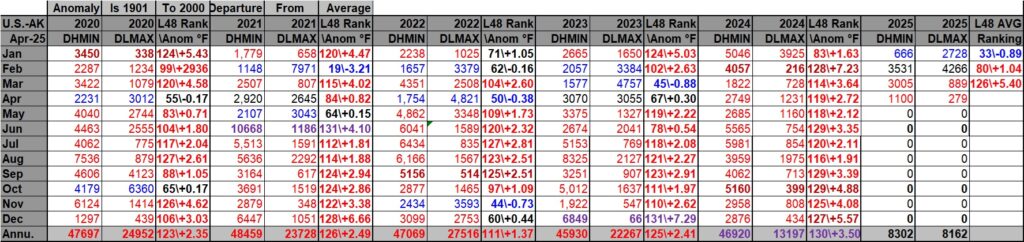
DHMX= Daily High Max Reports. DLMN= Daily Low Min Reports. DHMN= Daily High Min Reports. DLMX=Daily Low Max Reports.
Boldly highlighted red, blue, or purple colored months, such as December 2023 and June 2021, that have ratios of >10 to 1 daily or <1 to 10 of daily warm to low records are either historically hot or cold, most of which have made news. NCEI rankings are for the lower 48 states with the warmest ranking since 1895 of average temperatures being 130 and 1 being the coldest as of 2024. Blue colors represent cold months and red warm. Those months and years with counts close to a 1 to 1 ratio of highs to lows are colored black. All-time record hottest or coldest months and years are boldly colored in purple. NCDC rankings have been color coded (under tabs in each file) such that values of 55 to 75 are black representing neutral months or years (+ or – 10 from the average ranking of 64).
Totals are record reports for the entire United States including all territories minus those from Alaska. I’ve subtracted those from Alaska to get a better representation of what has occurred across the lower 48 states in association with lower 48 state rankings.
March 2025 had approximately an 80 to 7 ratio of record DHMX to DLMN individual record counts, so the color I used for that month was dark red on the top chart.
March 2025 had approximately a 30 to 9 ratio of record DHMN to DLMX individual record counts, so the color I used for that month was red on the bottom chart.
Due to climate change, we are seeing fewer blue colors on these Record Scoreboards with time.
The average temperature lower 48 state ranking for March 2025 was 126, which was colored red since it was warmer than average. We are seeing fewer blue colors on my charts, and March 2025 was yet another red or warm month.
I color rankings of +10 to -10 from the average ranking for the lower 48 states of 65 black, indicating that these are near average temperature wise. The top warmest ranking for 2024 would be 130 since rankings began in 1895.
Looking at the type and number of record reports, April 2025 has gotten off to a warm start with most record warmth ending as of today February 7th due to a frontal passage. Meteorological models forecast near average temperatures nationwide for the remainder of the month except across the Northeast and Southeast where below average conditions may occur..
Interestingly, overall ratios for 2024 were higher than historic yearly ratios for other years from the 2020s as shown here…which is no surprise given how hot the globe was during this record hot year thanks to climate change:
Here is much more detailed climatology for the March 2025 as complied by NOAA:
https://www.ncei.noaa.gov/news/national-climate-202503
Assessing the U.S. Climate in March 2025
Tornadoes in March were more than double the monthly average and three separate outbreaks produced more than 200 tornadoes

Published
April 8, 2025
Related Links
March 2025 U.S.Climate Report (Available April 11, 2025)
National Temperature and Precipitation Maps
Climatological Rankings Explained
State of the Climate Summaries
Key Points:
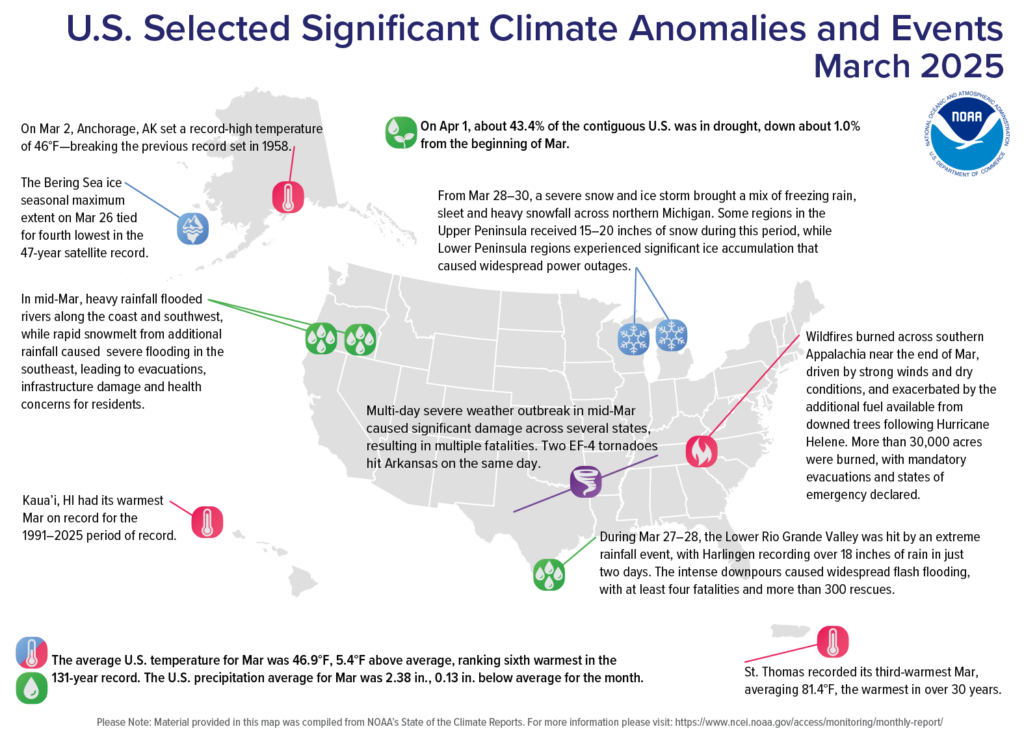
- A multi-day severe weather outbreak in the middle of March caused significant damage across several states from Texas to Tennessee, resulting in multiple fatalities. Two EF-4 tornadoes hit Arkansas on the same day.
- Wildfires spread across parts of southern Appalachia—burning more than 30,000 acres—driven by strong winds and dry conditions, and exacerbated by the additional fuel available from downed trees following Hurricane Helene.
- March was the sixth-warmest March on record for the contiguous U.S.
Other Highlights:
Temperature
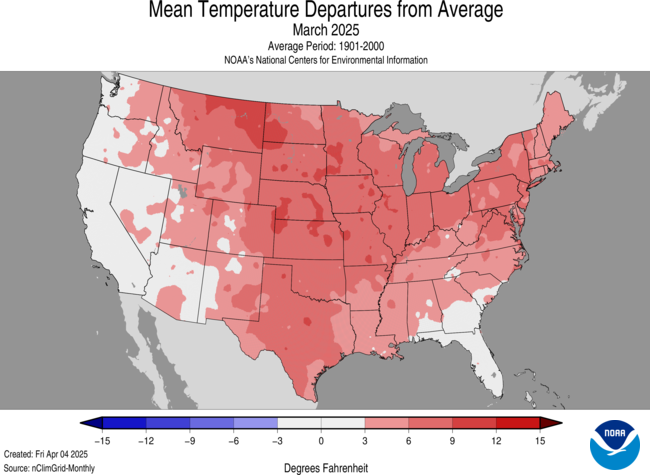
The average temperature of the contiguous U.S. in March was 46.9°F, 5.4°F above average. Generally, March temperatures were above average to much above average across most of the Lower 48, except for parts of California and the Southeast. Kansas had its fourth-warmest March on record (tied with 1946), with Nebraska and Texas recording their fifth warmest.
The Alaska statewide March temperature was 16.7°F, 5.9°F above the long-term average, ranking in the warmest third of the 101-year period of record. Southcentral Alaska and the North Slope experienced much-above-average temperatures during March.
For March, Hawai’i had an average temperature of 64.8°F, 1.3°F above the 1991–2020 average, ranking in the warmest third of the 35-year record. Kaua’i had its warmest March on record (for the 1991–2025 period of record).
For January–March, the average contiguous U.S. temperature was 37.0°F, 1.8°F above average, ranking in the warmest third of the record for this period. Temperatures were near- to above-average across most of the contiguous U.S.
The Alaska January–March average temperature was 14.5°F, 8.6°F above the long-term average, ranking fourth warmest for the first three months of the year.
Hawai’i had its third-warmest (tied with 2004) January–March average temperature of 64.5°F, 1.2°F above the 1991–2020 average for this period.
Precipitation
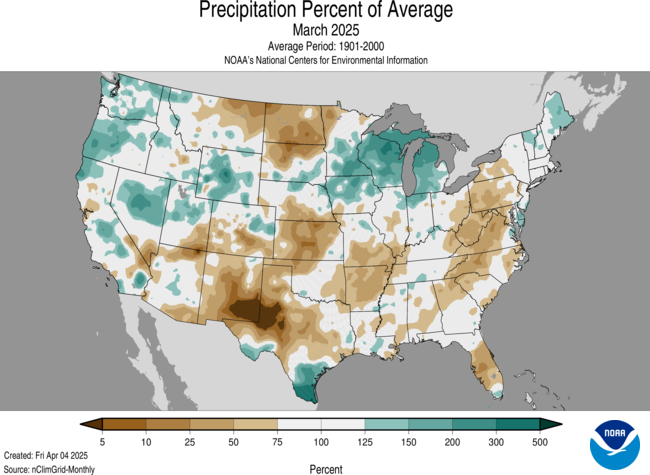
March precipitation for the contiguous U.S. was 2.38 inches, 0.13 inch below average, ranking in the middle third of the historical record. Precipitation was below average over much of the northern Plains and parts of the central and southern Plains, the central to southern Rockies, the middle Mississippi Valley and from the Carolinas to the eastern Great Lakes, with some areas being much below average. Western regions experienced near- to above-average precipitation while the Lower Rio Grande Valley, the upper Mississippi Valley and the Great Lakes regions had areas of much-above-average precipitation. West Virginia had its fifth-driest March, while Michigan and Wisconsin had their second- and fifth-wettest March on record, respectively.
Alaska’s average monthly precipitation in March ranked in the driest third on record.
Precipitation across Hawai’i in March averaged 4.23 inches, 2.62 inches below average, ranking in the middle third of the 1991–2025 record.
The January–March precipitation total for the contiguous U.S. was 5.92 inches, 1.04 inches below average, ranking in the driest third of the record for this period.
The January–March precipitation total for Alaska was 7.84 inches, 0.55 inch below average, ranking in the wettest third on record for the period.
Precipitation across Hawai’i from January–March was 11.54 inches, 5.52 inches below average, ranking in the middle third of the 1991–2025 record.
Drought
According to the April 1 U.S. Drought Monitor report, about 43.4% of the contiguous U.S. was in drought, down about 1.0% from the beginning of March. Drought conditions expanded or intensified across parts of the Southwest and the southern and central Plains, while contracting or reducing in intensity across parts of the northern Rockies, Great Lakes and along portions of the middle and northern Atlantic coast.
Monthly Outlook
Above-average temperatures are likely across the Southwest, extending through the South and Gulf Coast to the Southeast. Drier-than-average conditions are favored in the Southwest and Florida Peninsula, while above-average rainfall is likely from the south-central Plains to the Ohio Valley.
Drought is expected to persist across much of the Southwest, northern Plains and parts of the central and southern Plains, while some drought improvement is expected in the Great Lakes region and along the northern Atlantic coast. Visit the Climate Prediction Center’s Official 30-Day Forecasts and U.S. Monthly Drought Outlook website for more details.
Significant wildland fire potential for April is above normal across parts of the Southwest, extending through the southern and central Plains, portions of the northern Plains and upper Mississippi Valley, the southern to Mid-Atlantic coastal regions and southern Alaska. For additional information on wildland fire potential, visit the National Interagency Fire Center’s One-Month Wildland Fire Outlook.
For more detailed climate information, check out our comprehensive March 2025 U.S. Climate Report scheduled for release on April 11, 2025. For additional information on the statistics provided here, visit the Climate at a Glance and National Maps webpages.
Here are more “ETs” recorded from around the planet the last couple of days, their consequences, and some extreme temperature outlooks, as well as any extreme precipitation reports:
Here is More Climate News from Wednesday:
(As usual, this will be a fluid post in which more information gets added during the day as it crosses my radar, crediting all who have put it on-line. Items will be archived on this site for posterity. In most instances click on the pictures of each tweet to see each article. The most noteworthy items will be listed first.)