The main purpose of this ongoing blog will be to track planetary extreme, or record temperatures related to climate change. Any reports I see of ETs will be listed below the main topic of the day. I’ll refer to extreme or record temperatures as ETs (not extraterrestrials).😜
Main Topic: The Rise of Heatwave Pemex
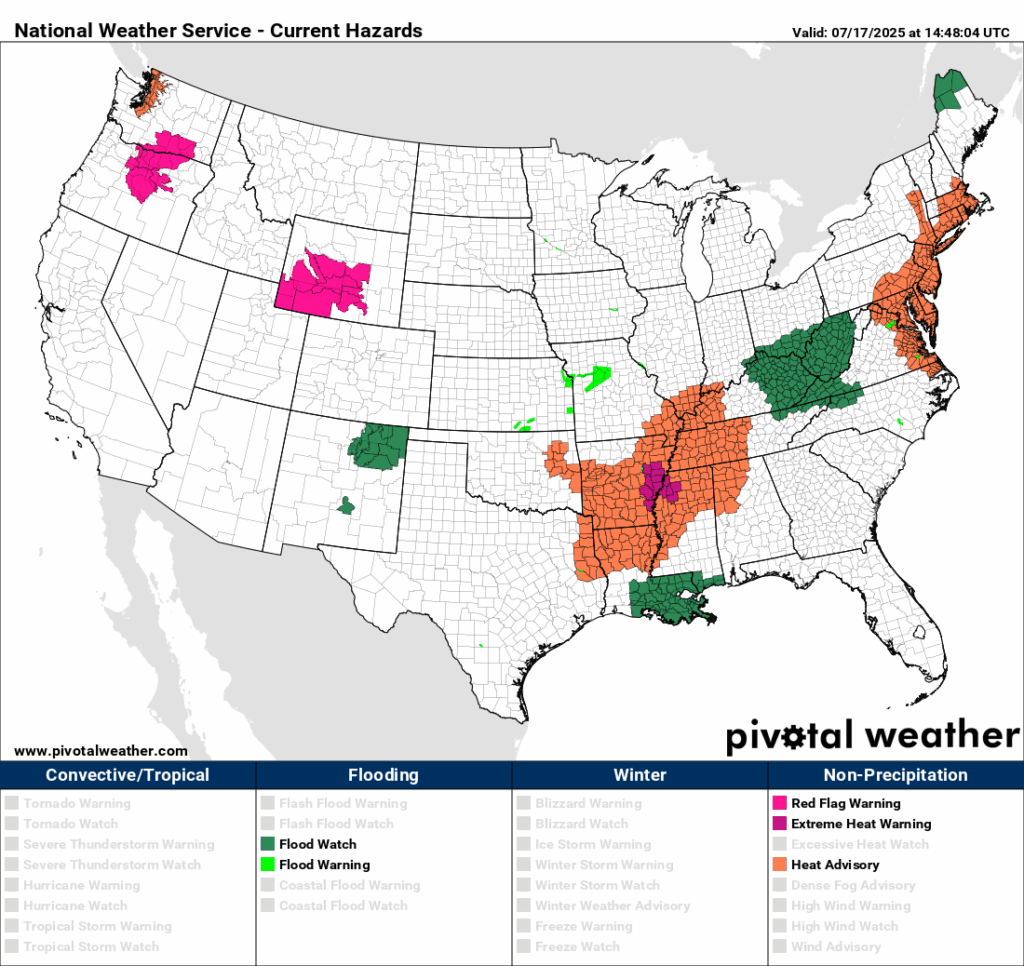
Dear Diary. It has been about a week since we had a major heatwave across a portion of the U.S. In this day and age of climate change, we know that this reprieve couldn’t last for long during July. Heatwave Texaco is barely hanging on across western Washington as a CAT1 today. The heat dome responsible for this system has been in the process of breaking down this week. A new heat dome has been building in the East in response to a trough quelling Texaco in the West.
Florida is gonna Florida this weekend. As the moisture moves out, the heat will crank up!! A weekend heat dome will settle over Florida with highs in the mid 90s and peak Heat Index numbers near 110 in some spots! @WFLApic.twitter.com/bM4KkzSSqn
Already this week we have dangerous conditions across the East Coast and some heat warnings and advisories across the Mid-South. Using my system, this heatwave is pegged as a dangerous CAT2 and is well on its way to being a major CAT3. The next oil company name I will use once the system gets to be a CAT3 is Pemex, named for the state-run Mexican oil company.
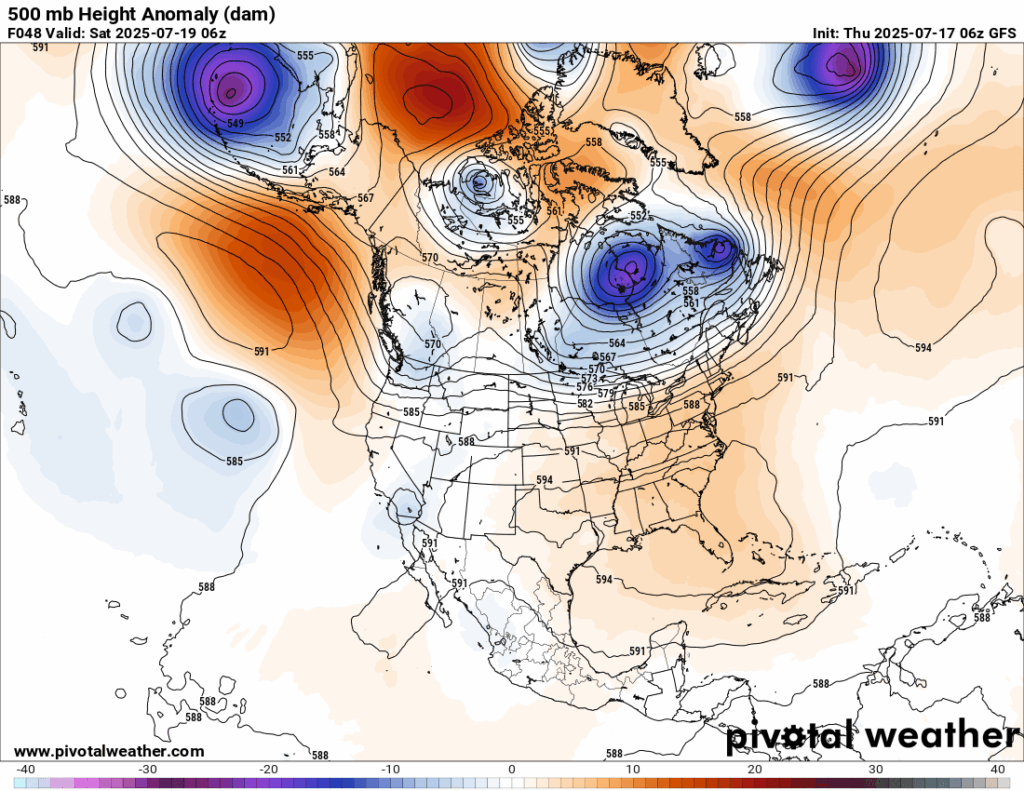
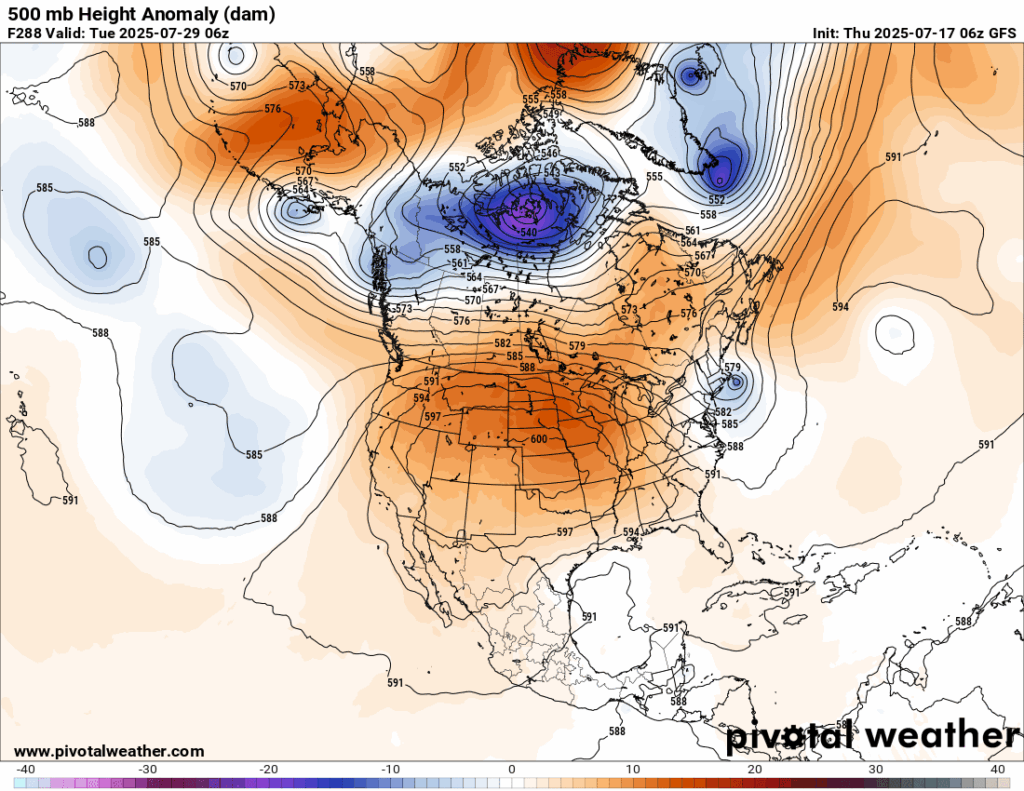
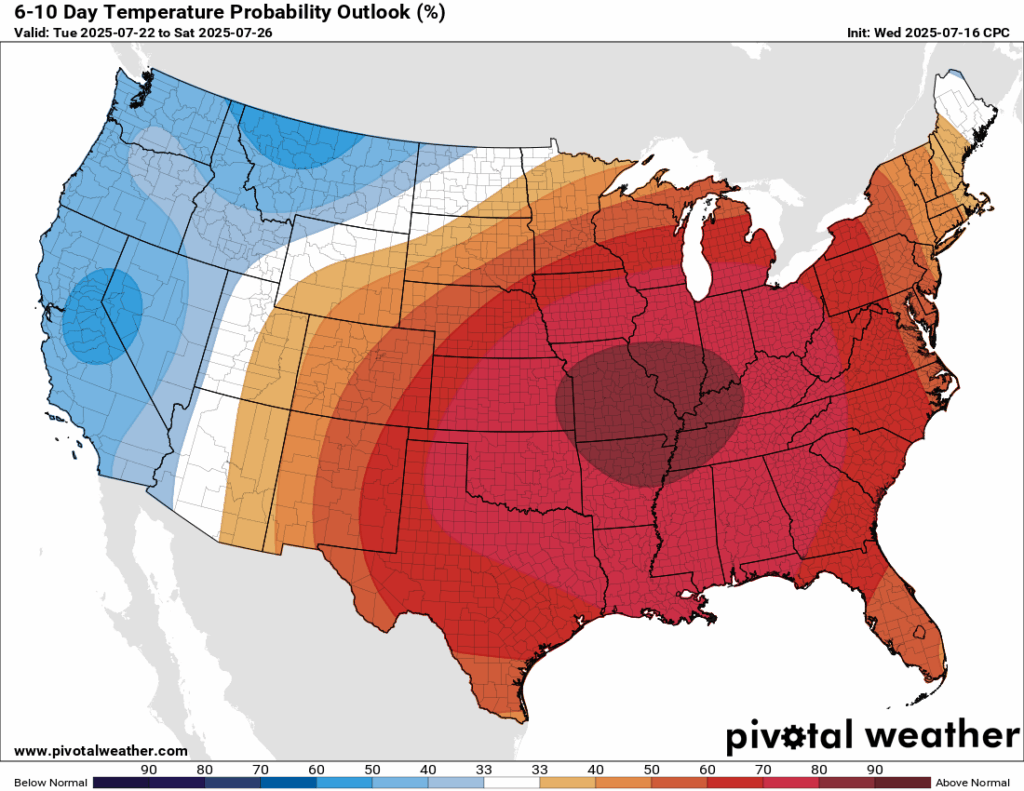
Unlike with Texaco, the heat dome in association with Pemex will be long lasting and will probably spread through much of the nation the next two weeks:
We know that the above two panels will verify with the heat done growing looking at model ensembles:
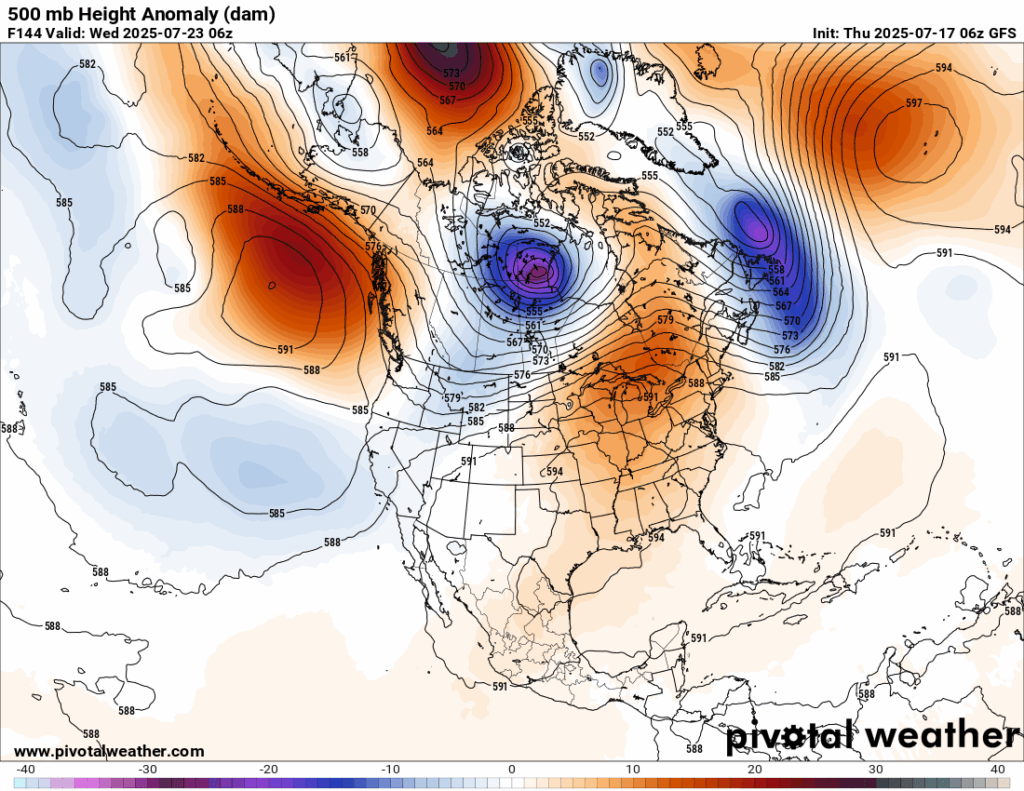
There is a good chance that Pemex will grow into a monstrous historic CAT4 towards the end of the month:
We will see if we eventually have a 597+ or God forbid 600+ decameter heat dome closer to August. In the meantime, many will be sweltering in a more typical heatwave due to about a 594-596 decameter ridge centered over the Mid-South that will produce some dangerous conditions as far north as the southern Midwest and Northeast.
Here are more “ET’s” recorded from around the planet the last couple of days, their consequences, and some extreme temperature outlooks, as well as any extreme precipitation reports:
BRUTAL HEAT IN MIDDLE EAST & CENTRAL ASIA
Up to 52C in Iran and Iraq with also extreme hot nights and records. Min 33.2 Dezful IRAN :Hottest night in history
— Extreme Temperatures Around The World (@extremetemps) July 17, 2025
CHINA RECORD HEAT
Another extremely hot day in China with temperatures up to 42.7C at Tiancheng. 27 stations broke their July records including Langzhong,Cangxi.Jingyan,Qianwei,Pengshan,….👇 of which 37.6C Yingjing was an all time record.
— Extreme Temperatures Around The World (@extremetemps) July 17, 2025
EXTRAORDINARY HEAT IN OCEANIA Hottest nights Records everywhere. Examples: HIGH MINS
28.0 Manhiki COOK ISLANDS JULY HOTTEST NIGHT 28.2 Christmas KIRIBATI 24.8 Nausori FIJI FRENCH POLYNESIA 26.8 Bora Bora 26.1 Hao NEW CALEDONIA 24.1 Ile Loop 23.7 La Roche 22.2 La Tontouta etc pic.twitter.com/U3Ouv6fkFF
— Extreme Temperatures Around The World (@extremetemps) July 16, 2025
#SLC issues Record Event Report (RER) at Jul 17, 8:44 PM MDT …RECORD HIGH MINIMUM TEMPERATURE FOR JULY 17TH… https://t.co/CPR6UJIvZ1
— NWS Record Event Reports (@iembot_rer) July 18, 2025
#GID issues Record Event Report (RER) at Jul 17, 9:36 PM CDT …Record-Cool High Temperature For July 17th at Grand Island Nebraska… https://t.co/5LIe4JGBxI
— NWS Record Event Reports (@iembot_rer) July 18, 2025
#MPX issues Record Event Report (RER) at Jul 17, 4:32 PM CDT …RECORD LOW TEMPERATURE SET AT TWIN CITIES MN… https://t.co/0av7lAici4
— NWS Record Event Reports (@iembot_rer) July 17, 2025
#ABR issues Record Event Report (RER) at Jul 17, 5:36 PM CDT …RECORD LOW TEMPERATURE SET AT PIERRE SD… https://t.co/qJGx0PF0Se
— NWS Record Event Reports (@iembot_rer) July 17, 2025
#ABR issues Record Event Report (RER) at Jul 17, 5:37 PM CDT …RECORD LOW TEMPERATURE SET AT MOBRIDGE SD… https://t.co/4wJjqJulcO
— NWS Record Event Reports (@iembot_rer) July 17, 2025
#FGF issues Record Event Report (RER) at Jul 17, 7:15 AM CDT …RECORD LOW TEMPERATURE TIED AT FARGO HECTOR INTL AP ND… https://t.co/mGHCy54K5j
— NWS Record Event Reports (@iembot_rer) July 17, 2025
#BIS issues Record Event Report (RER) at Jul 17, 7:31 PM CDT …RECORD LOW TEMPERATURE SET AT BISMARCK AND TIED AT DICKINSON ND… https://t.co/Sy6iovuR3Y
— NWS Record Event Reports (@iembot_rer) July 18, 2025
#DLH issues Record Event Report (RER) at Jul 17, 4:27 PM CDT …RECORD LOW TEMPERATURE SET AT INTERNATIONAL FALLS… https://t.co/W1UglY89Uu
— NWS Record Event Reports (@iembot_rer) July 17, 2025
#FGF issues Record Event Report (RER) at Jul 17, 7:15 AM CDT …RECORD LOW TEMPERATURE SET AT GRAND FORKS INTL AP ND… https://t.co/YRVcxbdqow
— NWS Record Event Reports (@iembot_rer) July 17, 2025
Here is More Climate News from Thursday:
(As usual, this will be a fluid post in which more information gets added during the day as it crosses my radar, crediting all who have put it on-line. Items will be archived on this site for posterity. In most instances click on the pictures of each tweet to see each article. The most noteworthy items will be listed first.)
78 U.S. cities experienced at least a week of days at or above a Climate Shift Index (CSI) of 2 during June 2025… (meaning climate change made temperatures those days at least 2x as likely).Our monthly U.S. attribution report by @climatecentral.org (June): www.climatecentral.org/report/month…
Reflecting on average temperatures over the last 3 months – find your location…🟥 warmer than average🟦 colder than averageDataset described in doi.org/10.1175/BAMS…
Carbon dioxide (CO₂) averaged about 430 ppm in June 202510 years ago June averaged about 403 ppm Preliminary data from @noaa.gov: gml.noaa.gov/ccgg/trends/
Methane (CH₄) is a potent greenhouse gas. Here are the latest monthly observations… 🧪⚒️March 2025 – 1934.49 ppbMarch 2024 – 1927.58 ppb + Data: gml.noaa.gov/ccgg/trends_…+ More info on methane budget and trends: essd.copernicus.org/articles/17/…
I have a goal of adding one new visual per day at zacklabe.com/united-state…, and this one was particularly eye-opening – sea surface temperatures averaged by year for the Caribbean… 🌀🌊Data from @noaa.gov OISSTv2.1 (downloads.psl.noaa.gov/Datasets/noa…).
Temperature anomalies averaged over the last month (left), 3 months (center), and 12 months (right) across the Northern Hemisphere…Data from @copernicusecmwf.bsky.social ERA5 reanalysis.
Now showing average June #Arctic sea ice volume since the year 1901… A high resolution version of this graphic can be downloaded at zacklabe.com/arctic-sea-i…. Comparison between PIOMAS-20C and PIOMAS datasets available at doi.org/10.1175/JCLI….
Last month was the 3rd hottest June on record globally…It was also separately the 6th warmest June for global land areas and the 3rd warmest for global ocean areas. Data provided by @noaa.gov NOAAGlobalTemp v6.0.0 (www.ncei.noaa.gov/products/lan…)
Now that NOAA is no longer tracking billion-dollar weather disasters, rely on insurance broker Gallagher Re, who just released their list for the first half of 2025. So far, we are near the 10-year average. The CA wildfires ($65 billion) were the 8th-costliest weather disaster in world history.
— NWS Storm Prediction Center (@NWSSPC) July 17, 2025
The little disturbance bringing rain to the northern Gulf will move slowly inland, & trailing moisture over Florida will keep the scattered shower/storm activity going. As we get further into summer now, our view widens out to the entire tropical Atlantic. Nothing brewing. pic.twitter.com/XukFLmMLiA
#ThursdayMorning Reading – #NWS: “If we had a massive rain event like we had in Kerr [County], Texas … in a half-dozen cities around the United States right now, I’d shudder to think what would happen” Critical staffing shortages at Calif. NWS Offices.https://t.co/09ROcmPX6Lpic.twitter.com/4Br5tnmWug
This has been the second most humid summer in DC on record (since 1945) based on the number of hours with dew points over 70 degrees or the level considered GROSS.
Another day. Another flash flood—this time across New York and New Jersey.Record rainfall in a short span overwhelmed streets, subways, and neighborhoods.• Here's what happened (via @nytimes.com): www.nytimes.com/live/2025/07… • 🧵below is how climate change played a role ⤵️
Good wx geeks podcast this weekDaryl’s work is a great example of providing a “value added” service to weather and climate dataI literally sit on a repo of the data at NCEI, but more often than not I’m going to IEM to get information quicklyKudos @akrherz.bsky.social linktr.ee/WeatherGeeks
Today’s News on Sustainable Energy, Traditional Polluting Energy from Fossil Fuel, and the Green Revolution:
#ThursdayMorning Reading #SolarEnergy "The Imperial Valley conflict is one manifestation of an increasingly sharp debate within California’s $60 billion agricultural sector…over what should happen as the acreage devoted to crops and livestock shrinks."https://t.co/3AeFyn8DgI
#ThursdayMorning Reading: "An old training method is experiencing an astonishing renaissance in the 2025 Tour de France." Gee I wonder why? Only the hottest summer in Europe, again. https://t.co/YfBl4hNAbb
If you like these posts and my work on record temperature ratios, please contribute via my PayPal widget on this site. Thanks in advance for any support.