The main purpose of this ongoing blog will be to track planetary extreme, or record temperatures related to climate change. Any reports I see of ETs will be listed below the main topic of the day. I’ll refer to extreme or record temperatures as ETs (not extraterrestrials).😜
Main Topic: U.S. October 2025 Record Scoreboard and Climatological Review
Dear Diary. We are way overdue for a monthly climatological review because of the U S. government shutdown. Now that NCEI has been back up and running for over a week, they have managed to process both September and October 2025 data and have written up a U.S. report for October. Here on this site, we usually present monthly summaries near the 10th of each month, and each is available by clicking the link below:
https://guyonclimate.com/category/record-scoreboard-climatological-reviews
I’m repeating this mantra every month:
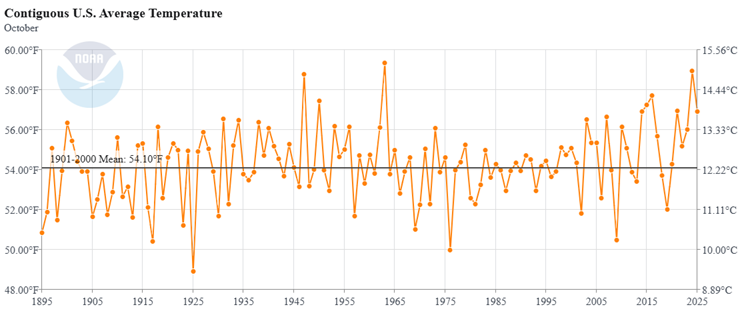
October 2025 got ranked by the National Center for Environmental Information for the lower 48 states as 8th warmest or 124th coolest since records began being kept in 1895 at +2.83°F above the 1901-2000 average.

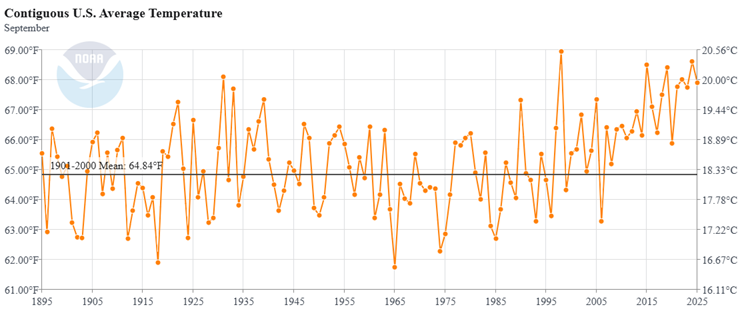
September 2025 got ranked by the National Center for Environmental Information for the lower 48 states as 7th warmest or 125th coolest since records began being kept in 1895 at +3.07°F above the 1901-2000 average.

The above data was from:
https://www.ncdc.noaa.gov/cag/national/rankings
During October the warmest conditions were in the central portion of the nation. Most reports of record chill came from the West. Most reports of record warmth occurred in the central part of the nation.
You can check out record totals for yourself on my NCEI record archives:
NCEI Record Count Archive – Guy On Climate
Here are my two U.S. Daily Record Scoreboards updated through 11/03/2025 (data compiled from the following NCEI site):
https://www.ncdc.noaa.gov/cdo-web/datatools/records
I’m also keeping tabs on record report totals to verify a scientific study I helped to complete in the decade of the 2000s. We’ll eventually see how skewed ratios of record warm to cold reports get by the year 2100, which the study mentions as 50-1 for DHMX vs. DLMN:
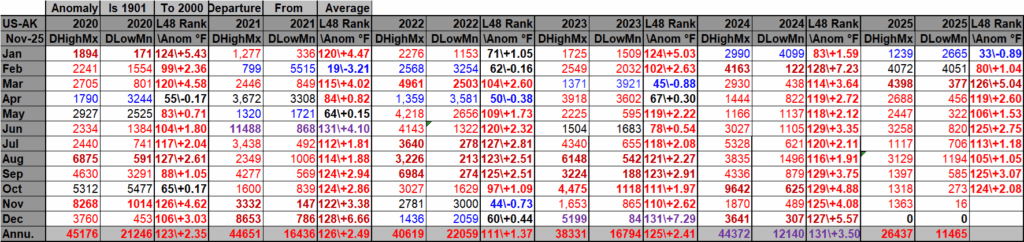
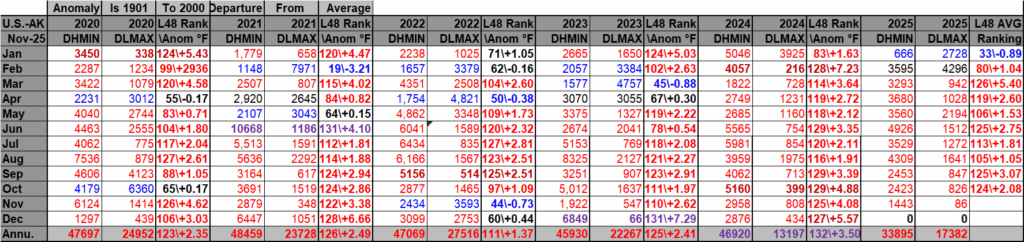
DHMX= Daily High Max Reports. DLMN= Daily Low Min Reports. DHMN= Daily High Min Reports. DLMX=Daily Low Max Reports.
Boldly highlighted red, blue, or purple colored months, such as December 2023 and June 2021, that have ratios of >10 to 1 daily or <1 to 10 of daily warm to low records are either historically hot or cold, most of which have made news. NCEI rankings are for the lower 48 states with the warmest ranking since 1895 of average temperatures being 131 and 1 being the coldest as of 2025. Blue colors represent cold months and red warm. Those months and years with counts close to a 1 to 1 ratio of highs to lows are colored black. All-time record hottest or coldest months and years are boldly colored in purple. NCDC rankings have been color coded (under tabs in each file) such that values of 55 to 75 are black representing neutral months or years (+ or – 10 from the average ranking of 64).
Totals are record reports for the entire United States including all territories minus those from Alaska. I’ve subtracted those from Alaska to get a better representation of what has occurred across the lower 48 states in association with lower 48 state rankings.
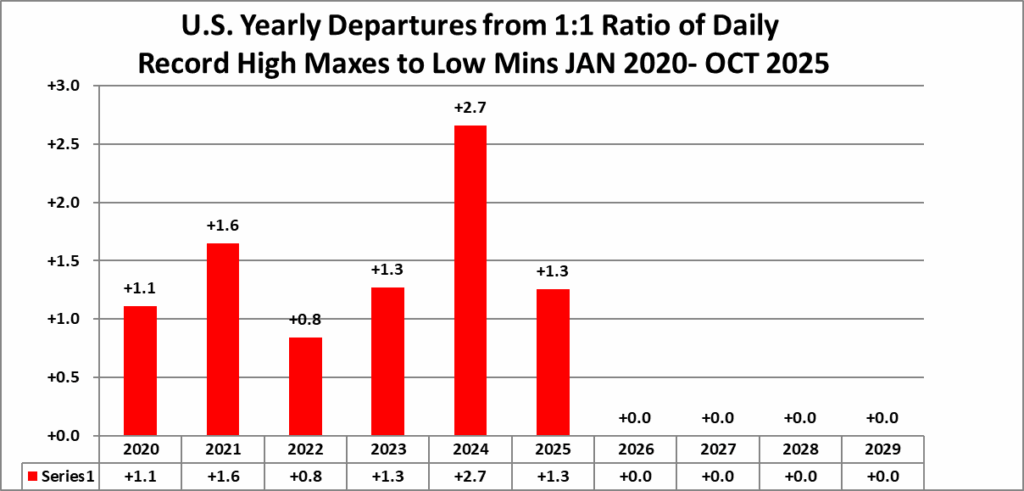
October 2025 had approximately a 13 to 3 ratio of record DHMX to DLMN individual record counts, so the color I used for that month was dark red on the top chart.
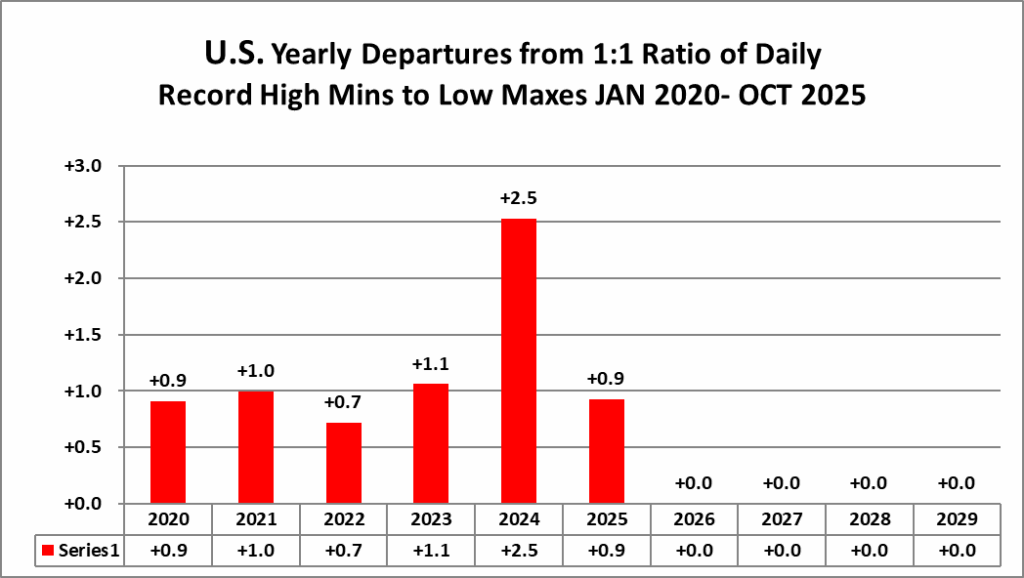
October 2025 had approximately a 3 to 1 ratio of record DHMN to DLMX individual record counts, so the color I used for that month was red on the bottom chart.
Due to climate change, we are seeing fewer blue colors on these Record Scoreboards with time.
The average temperature lower 48 state ranking for October 2025 was 124, which was colored red since it was warmer than average. We are seeing fewer blue colors on my charts, and October 2025 was yet another red or warm month.
I color rankings of +10 to -10 from the average ranking for the lower 48 states of 65 black, indicating that these are near average temperature wise. The top warmest ranking for 2025 would be 131 since rankings began in 1895.
Looking at the type and number of record reports, November 2025 has gotten off to a warm start, and meteorological models are consistently forecasting an above average November for temperatures despite the first record cold shot stretching from the Midwest into the Southeast.
Interestingly, here is what we see as far as overall yearly ratios go for the 2020s so far. Warmth is key here:
Here is much more detailed climatology for the October 2025 as complied by NOAA:
Assessing the U.S. Temperature and Precipitation Analysis in October 2025
Central U.S. was warm and dry in October, while storms battered the coastal regions

Courtesy of Canva.com
Key Points:
- The contiguous U.S. (CONUS) experienced the eighth-warmest October in the 131-year record.
- October featured widespread storm activity along the nation’s periphery, as remnants of tropical cyclones caused flooding in Alaska, the Southwest and Puerto Rico, and powerful atmospheric rivers and coastal storms lashed the West and East Coasts.
- Warm and dry conditions across the interior contributed to a slight increase in the national drought coverage to 43.7%.
")
Other Highlights:
Temperature

The average October temperature for the CONUS was 56.9°F, which is 2.8°F above the 20th-century average. Above- to much-above-average temperatures covered much of the central U.S. as well as the far Northeast. Thirteen states recorded a top-10 warm October, with Kansas, Iowa, Illinois, Minnesota and Texas each averaging at least 5°F above their 20th-century averages. In contrast, parts of the Northwest and Mid-Atlantic experienced below-average temperatures, particularly for daytime highs.
Alaska’s average temperature was 31.5°F, which is 6.0°F above the 1925–2000 average and tied for the ninth-warmest October in the 101-year record. Much-above-average warmth affected portions of Southcentral Alaska, the Interior and the North Slope.
Hawai‘i’s average temperature for October was 68.5°F, 0.2°F above the 1991–2020 average and ranking in the middle third of its 35-year record.
Precipitation

Precipitation for the CONUS totaled 2.33 inches in October, which is 0.17 inch above average and ranks in the middle third of the record. Above-average precipitation fell across portions of the Western U.S., the Rocky Mountains and northern Plains, as well as parts of the lower Mississippi Valley, the western Ohio Valley and eastern Carolinas. In contrast, much of the central U.S. saw near- or below-average October rainfall.
Remnants of tropical cyclones and strong storm systems impacted multiple U.S. regions throughout October. Alaska and the Southwest faced flooding from the remnants of Super Typhoon Halong and Hurricane Priscilla, respectively, while outer bands from Hurricane Melissa led to flash flooding in Puerto Rico. The Pacific Coast was impacted by a rare mid-month storm and a subsequent series of atmospheric rivers. In the East, two coastal systems brought heavy rain, high winds and flooding to the Mid-Atlantic and Northeast, disrupting travel and causing widespread power outages.
Alaska received 5.18 inches of precipitation in October, 0.79 inch above average, ranking in the wettest third of the record. Parts of the West and Interior were much wetter than normal, and the North Slope averaged more than 2 inches, marking its wettest October on record.
Precipitation for Hawaii in October averaged 3.55 inches, 1.57 inches below the 1991–2020 average and in the driest third of the record.
Drought
According to the November 4 U.S. Drought Monitor report, about 43.7% of the contiguous U.S. was in drought, a slight increase of 0.7% from the end of September.
Drought contracted or reduced in intensity across parts of the western U.S. and portions of the Tennessee and Ohio Valleys. However, drought developed in parts of the southern Plains and portions of the Mississippi Valley, and further intensified in parts of the Southeast, Great Lakes and Northeast.
For more detailed climate information, check out our comprehensive October 2025 U.S. Climate Report scheduled for release on November 25, 2025. For additional information on the statistics provided here, visit the Climate at a Glance and National Maps webpages.
Related Links
October 2025 U.S. Climate Report (Available November 25, 2025)
National Temperature and Precipitation Maps
Climatological Rankings Explained
State of the Climate Summaries
Here are some “ETs” recorded from around the planet the last couple of days, their consequences, and some extreme temperature outlooks, as well as any extreme precipitation reports:
Here is More Climate News from Friday:
(As usual, this will be a fluid post in which more information gets added during the day as it crosses my radar, crediting all who have put it on-line. Items will be archived on this site for posterity. In most instances click on the pictures of each tweet to see each article. The most noteworthy items will be listed first.)
Hello. Great work. Thanks. To visualize the climate changes, it is like how fast the ice cubes melt and are new ice cubes forming. That would confirm and explain a lot. Give clues and visualize the time of future on and in earth.
You are most welcome Joseph.