The main purpose of this ongoing blog will be to track planetary extreme, or record temperatures related to climate change. Any reports I see of ETs will be listed below the main topic of the day. I’ll refer to extreme or record temperatures as ETs (not extraterrestrials).😜
Main Topic: U.S. January Record Scoreboard and Climatological Review
Dear Diary. It’s time for our monthly climatological review. Here on this site, we usually present monthly summaries near the 8th of each month, and each is available by clicking the link below:
https://guyonclimate.com/category/record-scoreboard-climatological-reviews
I’m repeating this mantra every month:
January 2026 got ranked by the National Center for Environmental Information for the lower 48 states as 24th warmest or 109th coolest since records began being kept in 1895 at +3.07°F above the 1901-2000 average.
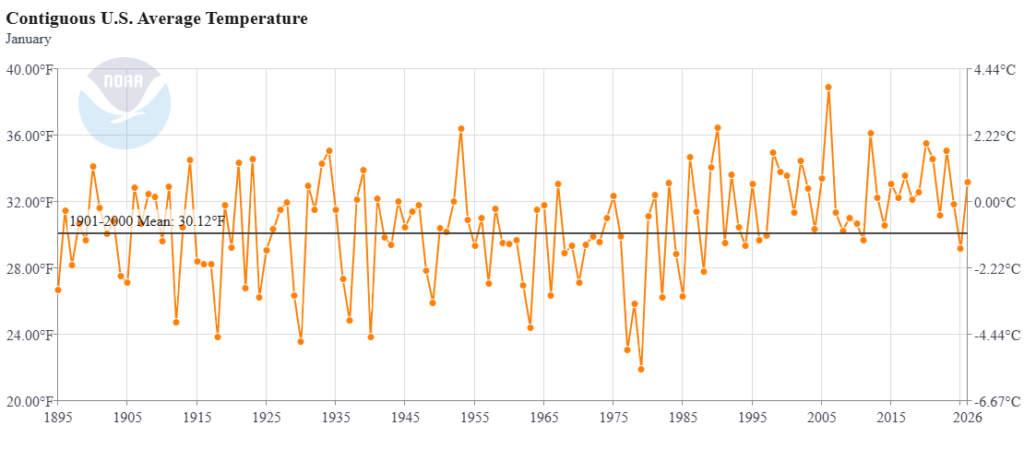
Above average temperatures from December continued across the western states. A couple of Arctic outbreaks chilled the eastern half of the country during the second half of the month such that near to below average conditions occurred there.
The above data was from:
https://www.ncdc.noaa.gov/cag/national/rankings
You can check out record totals for yourself on my NCEI record archives:
NCEI Record Count Archive – Guy On Climate
Here are my two U.S. Daily Record Scoreboards updated through 2/09/2026 (data compiled from the following NCEI site):
https://www.ncdc.noaa.gov/cdo-web/datatools/records
I’m also keeping tabs on record report totals to verify a scientific study I helped to complete in the decade of the 2000s. We’ll eventually see how skewed ratios of record warm to cold reports get by the year 2100, which the study mentions as 50-1 for DHMX vs. DLMN:
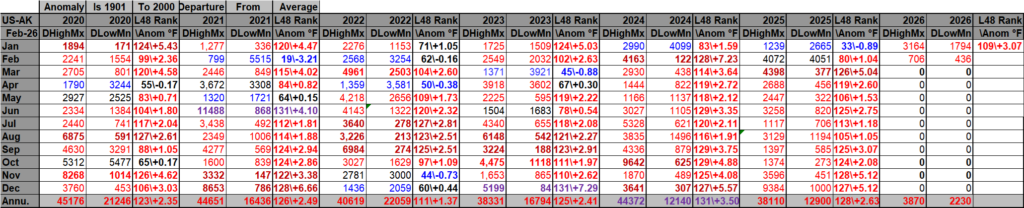
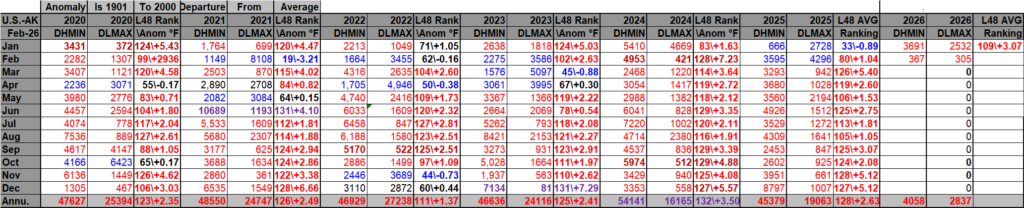
DHMX= Daily High Max Reports. DLMN= Daily Low Min Reports. DHMN= Daily High Min Reports. DLMX=Daily Low Max Reports.
Boldly highlighted red, blue, or purple colored months, such as December 2023 and June 2021, that have ratios of >10 to 1 daily or <1 to 10 of daily warm to low records are either historically hot or cold, most of which have made news. NCEI rankings are for the lower 48 states with the warmest ranking since 1895 of average temperatures being 131 and 1 being the coldest as of 2025. Blue colors represent cold months and red warm. Those months and years with counts close to a 1 to 1 ratio of highs to lows are colored black. All-time record hottest or coldest months and years are boldly colored in purple. NCDC rankings have been color coded (under tabs in each file) such that values of 55 to 75 are black representing neutral months or years (+ or – 10 from the average ranking of 64).
Totals are record reports for the entire United States including all territories minus those from Alaska. I’ve subtracted those from Alaska to get a better representation of what has occurred across the lower 48 states in association with lower 48 state rankings.
January 2026 had approximately a 16 to 9 ratio of record DHMX to DLMN individual record counts, so the color I used for that month was red on the top chart.
January 2026 had approximately a 3 to 2 ratio of record DHMN to DLMX individual record counts, so the color I used for that month was red on the bottom chart.
Due to climate change, we are seeing fewer blue colors on these Record Scoreboards with time.
The average temperature lower 48 state ranking for January 2026 was 109, which was colored red since it was warmer than average. We are seeing fewer blue colors on my charts, and January 2026 was yet another red or warm month.
I color rankings of +10 to -10 from the average ranking for the lower 48 states of 65 black, indicating that these are near average temperature wise. The top warmest ranking for 2026 would be 132 since rankings began in 1895.
February 2026 got off to a cold start due to an Arctic outbreak of record cold air in the East, but since that ended after the 5th, record warmth in the West has put this month into positive average temperature territory, which should continue for the rest of the month looking at meteorological models.
Interestingly, here is what we see as far as overall yearly ratios go for the 2020s so far. Warmth is key here:
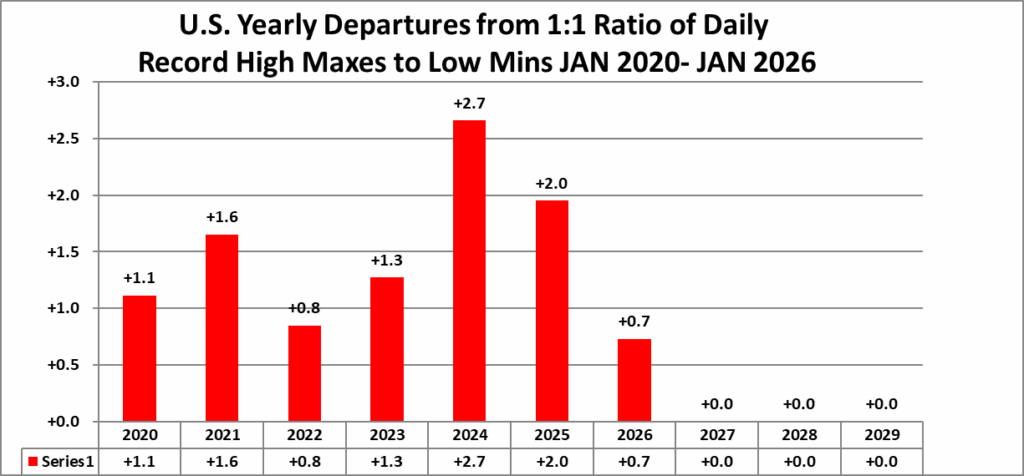
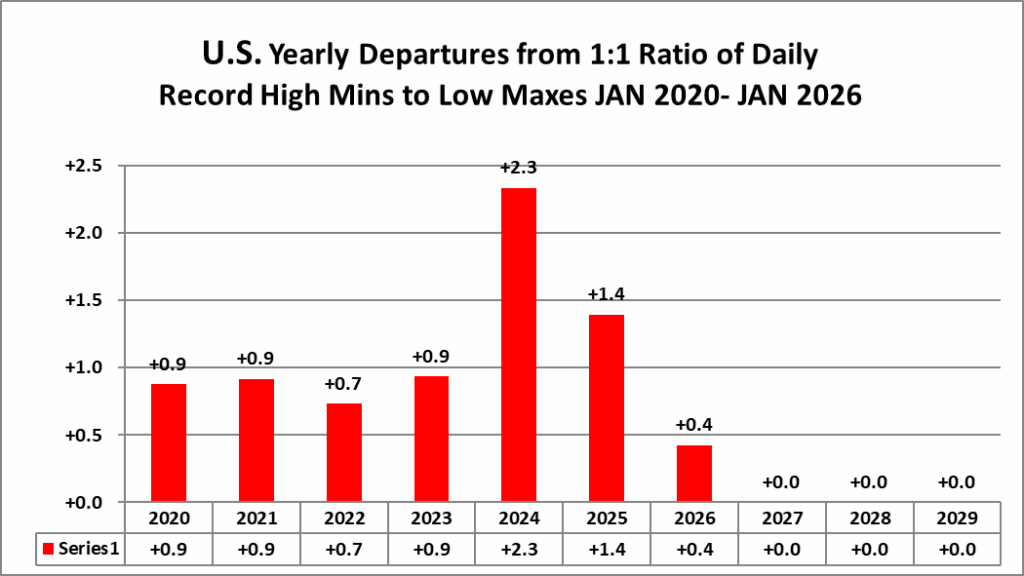
We now have 6 out of 10 full years’ worth of data for the 2020s. Interestingly, 2024 stands out as the warmest year, which was also the year with a strong El Niño.
Here is much more detailed climatology for January 2026 as complied by NOAA:
Assessing the U.S. Temperature and Precipitation Analysis in January 2026
Warmth Persisted Across the West in January While Wintry Weather Swept the Plains, South and East
Courtesy of Gettyimages
Key Points:
- A series of Arctic air masses brought bitterly cold temperatures as far as the Deep South and Florida, accompanied by significant snow and ice impacts.
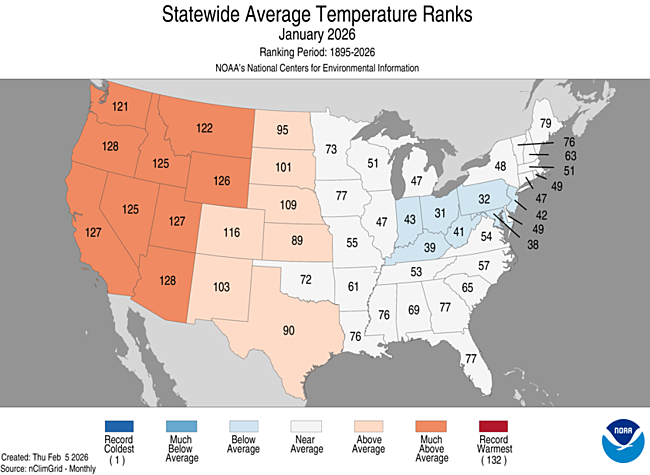
- Seven western states set record-warm temperatures for the beginning of winter (December–January).
 Map of the U.S. notable weather and climate events in January 2026.
Other Highlights:
Temperature
The average temperature for the contiguous U.S. (CONUS) in January was 33.2°F, 3.1°F above the 20th-century average, ranking in the warmest third of the 132-year record.

Temperatures were much above average across a large portion of the western third of the CONUS. Oregon, California, Utah and Arizona each had one of their six warmest starts to the year. Along with Washington, Nevada and New Mexico, they each recorded their warmest December–January period on record. In contrast, much of the eastern half of the country saw near-average January temperatures, with below-average conditions across portions of the Ohio Valley, Great Lakes and Mid-Atlantic.
Across Alaska, January’s average temperature was 0.7°F, 1.5°F below the 1925–2000 average, ranking in the middle third of the 102-year record. December’s cold snap persisted through the first half of January before later warmth tempered monthly averages. As a result, above-average January temperatures were observed across parts of southeastern Alaska and the North Slope, while below-average temperatures occurred across much of the Southwest and parts of the Interior.
Hawai’i had an average temperature of 64.2°F, 0.8°F above the 1991–2020 average, ranking in the warmest third of the 36-year record.
Precipitation
The average precipitation for the CONUS in January was 1.53 inches, 0.78 inch below the 20th-century average, ranking 11th-driest in the 132-year record. Precipitation was below average across much of the Northwest, Rockies and northern Plains, with Oregon, Montana and Wyoming each experiencing their driest January since 2001. Below-average precipitation also occurred across a broad swath from the southeastern Plains to the Northeast and across much of the Southeast.

In Alaska, January precipitation ranked in the wettest third of the 102-year record. The North Slope and much of interior, southern and southeastern Alaska received above-average precipitation, while parts of western Alaska, including the Aleutians, recorded below-average totals, with some locations seeing a record-dry January.
In Hawai’i, January precipitation averaged 5.06 inches, just 0.05 inch below the 1991–2020 average, ranking in the middle third of the 36-year record.
Drought
According to the February 3 U.S. Drought Monitor report, about 44.5% of the CONUS was in drought, up about 1.7% from the end of December. Drought conditions persisted across portions of the Northwest and Rockies, while some areas of improvement were observed across parts of the Southwest. Drought worsened across parts of the Plains and middle Mississippi Valley, while parts of the South and upper Midwest saw some improvement. The Southeast through the Mid-Atlantic saw drought expand and intensify, and drought persisted in the far Northeast and Hawai’i.
Monthly Outlook
Above-average temperatures are favored across parts of the West in February, while portions of the eastern U.S. are likely to be cooler than average. Parts of the West are leaning towards below-average precipitation, while portions of the northern tier favor above-average precipitation. Above-average temperatures and precipitation are favored across southern Alaska. Visit the Climate Prediction Center’s Official 30-Day Forecasts for more details.
Existing drought conditions across the CONUS are largely expected to persist through February, with additional development likely in parts of the southern Plains, Gulf Coast and Florida. Some drought improvement or removal is anticipated across small portions of the South, Carolinas and Mid-Atlantic, as well as parts of Hawaiʻi and the U.S. Virgin Islands. Visit the U.S. Monthly Drought Outlook website for more details.
Significant wildland fire potential for February is above normal across much of the southern Plains and Southeast, while it is below normal across Kentucky and far western Virginia. For additional information on wildland fire potential, visit the National Interagency Fire Center’s One-Month Wildland Fire Outlook.
For more detailed climate information, check out our comprehensive January 2026 U.S. Climate Report scheduled for release on February 12, 2026. For additional information on the statistics provided here, visit the Climate at a Glance and National Maps webpages.
Published
February 9, 2026
Here are some “ETs” recorded from around the U.S. the last couple of days, their consequences, and some extreme temperature outlooks, as well as any extreme precipitation reports:
Here is More Climate News from Monday:
(As usual, this will be a fluid post in which more information gets added during the day as it crosses my radar, crediting all who have put it on-line. Items will be archived on this site for posterity. In most instances click on the pictures of each tweet to see each article. The most noteworthy items will be listed first.)