The main purpose of this ongoing blog will be to track planetary extreme, or record temperatures related to climate change. Any reports I see of ETs will be listed below the main topic of the day. I’ll refer to extreme or record temperatures as ETs (not extraterrestrials).😜
Here is a new feature for this blog, which I will add daily. This is the latest inciteful Green News Report from my friends Desi Doyen and Brad Friedman at Progressive Voices. Hit ‘continue reading,’ listen, then hit return to see my daily topics:
Main Topic: How 65 Major U.S. Cities Are Responding to Urban Heat
Dear Diary. With all the emphasis on heat waves this and previous years, we should also note that urban heat islands during summer add to oppressive conditions. Unlike climate change, this is a fairly easy fix for city planners. By adding green spaces and insisting via laws that buildings and roads be made out of reflective materials urban temperature can be lowered by several degrees. For example, I’ve noticed that records for New York City’s Central Park is a few degrees lower than their airport locations for each Callender year.
Climate Central has produced an in-depth study on the urban heat island effect, which was published today and we are using for our main topic of this Wednesday:
How 65 Major U.S. Cities Are Responding to Urban Heat | Climate Central
Climate Matters • July 8, 2026 • Reuse this content
How 65 Major U.S. Cities Are Responding to Urban Heat
KEY FACTS
- The entire planet is warming due to human-caused climate change, but the built environment further amplifies both average temperatures and extreme heat in cities.
- Climate Central analysis shows that residents of the 65 largest U.S. cities experience an average of 8°F of extra heat due to the built environment.
- New resources compile examples of steps these 65 cities are taking to adapt the built environment and keep people cool during extreme heat events.
- Green space, urban trees, shade structures, water features, and cool pavements can all help reduce heat trapped by the built environment in cities.
- Climate change is making extreme heat more frequent and intense, and the built environment adds even more heat in cities. Ultimately, rapid and sustained cuts to heat-trapping pollution are essential for creating cooler, safer, more resilient cities.
This Climate Matters analysis is based on open-access data from multiple federal agencies, including the U.S. Census Bureau and the U.S. Department of Education. See Methodology for details.
DATA EXPLORER
FULL REPORT
In 65 large U.S. cities, the average resident experiences 8°F of extra heat due to the built environment
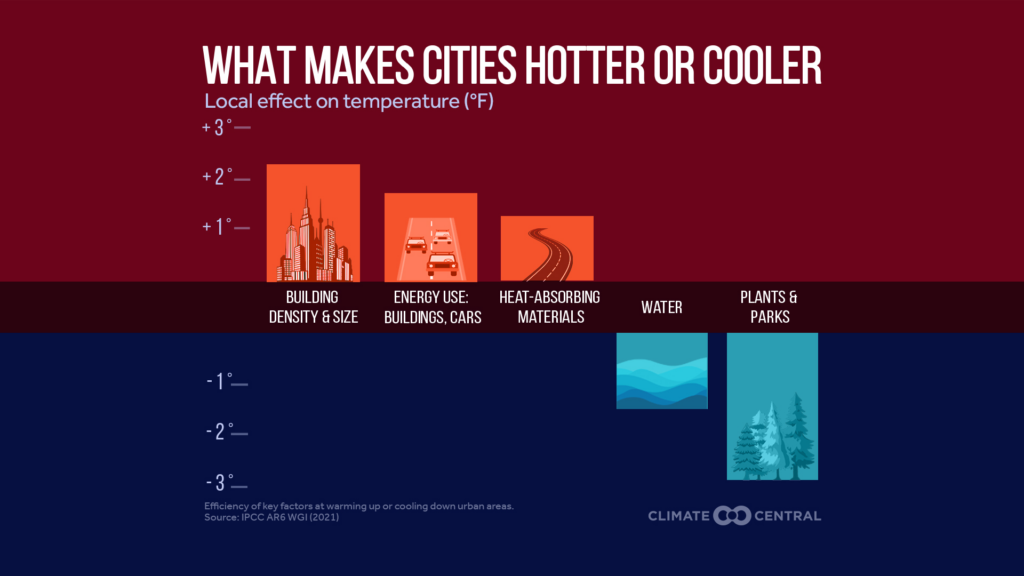
The entire planet is warming due to human-caused climate change. In cities, the built environment further amplifies both average temperatures and extreme heat.
This urban heat island (UHI) effect occurs because buildings, roads, and other infrastructure absorb and generate more heat than the natural environment does in less developed areas.
Extreme heat is the deadliest weather-related hazard in the U.S. During extreme heat events, the urban heat island effect can further worsen heat stress for the 80% of Americans who live in urban areas — putting heat-vulnerable groups at even greater risk and leading to higher energy bills and strained power grids due to spikes in cooling demand.
Urban Heat Hot Spots in 65 Cities, a 2024 Climate Central analysis, explores how and where urban heat islands boost temperatures within the census-defined boundaries of 65 large U.S. cities — home to 50 million people, or 15% of the total U.S. population.
Within each city, Climate Central calculated the UHI index for every census block group to estimate how much hotter these areas are due to the characteristics of the built environment.
This analysis found that the average resident in each of these 65 cities experiences 8°F of extra heat due to the built environment and local land use.
- Explore Urban Heat Hot Spots in 65 Cities for a detailed methodology and additional results.
What are U.S. cities doing to reduce urban heat?
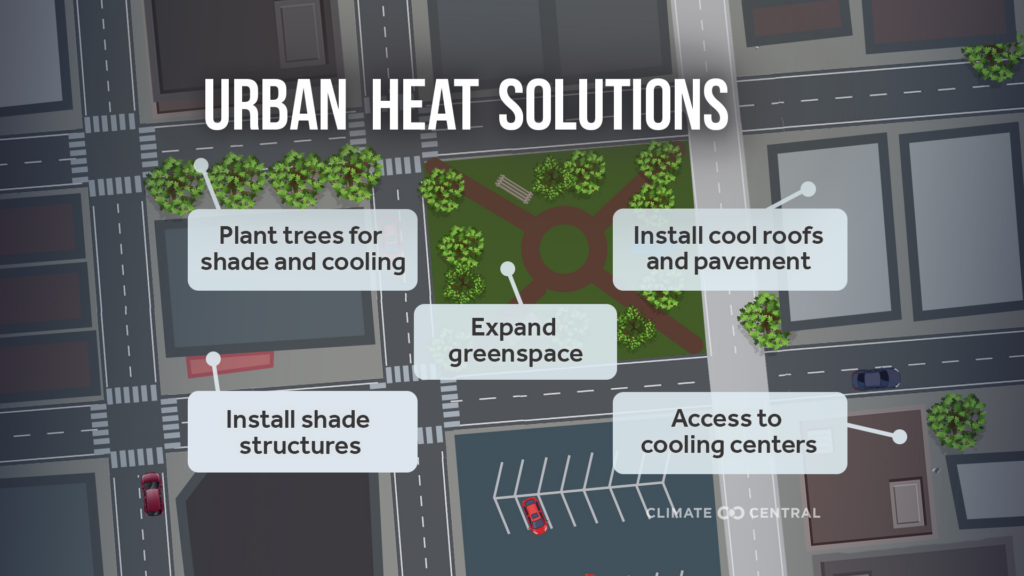
The good news is that cities can adapt the built environment to reduce urban heat. This brief highlights steps that these 65 U.S. cities are already taking to cool the built environment and keep people safe during extreme heat events.
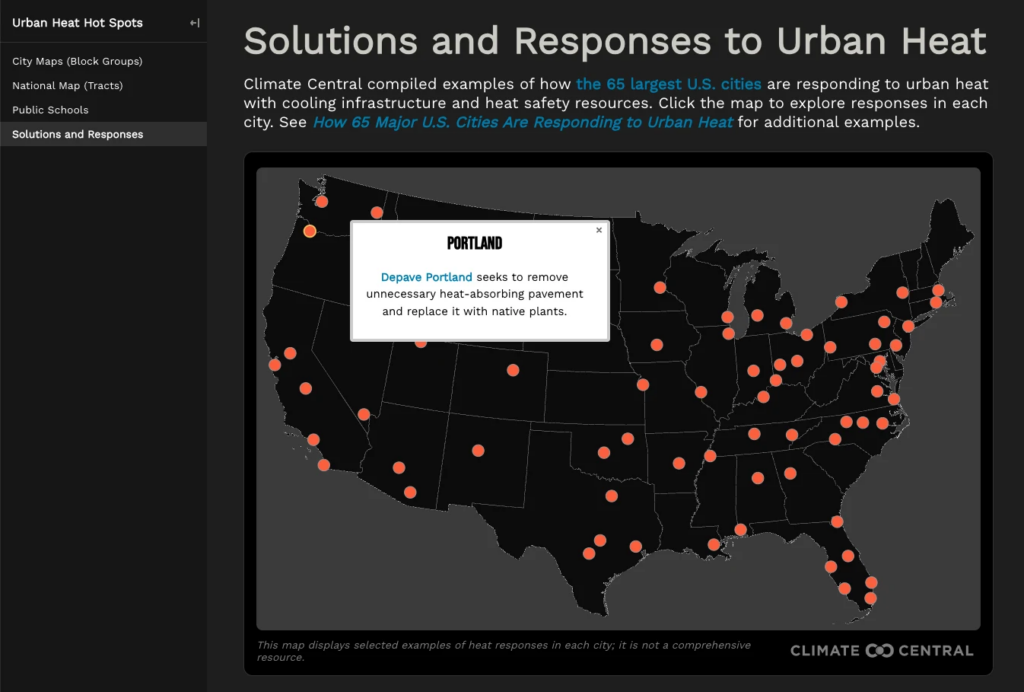
- Explore an interactive map and accompanying database highlighting specific solutions and responses to urban heat in place across these 65 cities.
Below is a summary of options for cities to cool the built environment and keep people safe during extreme heat events.
Trees and green space provide many benefits
Trees cool cities in two ways:
- Shading: The canopy of a mature tree provides shade that can cool maximum surface temperatures by more than 30°F.
- Evapotranspiration: When water evaporates from the leaves of trees through a process called evapotranspiration, it cools the surrounding air.
Other types of green spaces also effectively combat urban heat.
Although green space is generally an effective way to reduce urban heat (especially in dry and hot climates where water is limited), it’s not necessarily an effective choice for every city.
Selecting native trees that are resilient to the changing climate can help ensure that urban trees provide long-term benefits.
Beyond shading and cooling, urban trees and green spaces can also slow and soak up runoff, improve air quality, and remove heat-trapping carbon pollution while providing vital connections with nature.
- Explore The Power of Urban Treesto learn more about the benefits of urban trees in 242 U.S. cities.
Trees require care after planting and take time to grow, but studies indicate that the benefits of urban trees often outweigh the costs.
Shade from trees and other structures provides heat relief
Shade is a key way to cool cities, and trees aren’t the only option. Structures like shaded bus stops, awnings, canopies, and even other buildings block incoming energy from the sun.
Shaded areas can be 20-40°C cooler than areas in the sun, making an immediate difference for pedestrians, outdoor workers, and even the cost of cooling buildings.
Shade is not equitably distributed in U.S. cities, however. The poorest neighborhoods have 41% less shade from trees, on average, compared to the wealthiest neighborhoods.
Increasing shade in overheated areas can be an effective way to provide immediate heat relief.
Water features can moderate temperatures
Bodies of water such as rivers, lakes, ponds, or reservoirs — sometimes referred to as blue space — have the potential to reduce the urban heat island effect.
But not all blue space has a cooling effect in cities. Large bodies of water or those surrounded by green space are the most likely to effectively cool urban areas.
Interactive public water features like splashpads also help residents cool off in urban heat islands.
Cool pavements and roofs can reduce major sources of heat
Together, roofs and paved surfaces make up about 75% of the surface area in most U.S. cities, so reducing their heating effects can make a big difference.
Dark-colored paved surfaces absorb large amounts of incoming energy from the sun, making surface temperatures up to 20-30°C hotter than the surrounding air. These scorching surfaces radiate large amounts of heat into the surrounding air, especially at night, acting as a major contributor to the urban heat island effect.
One way that cities can reduce this heat source is by using cool pavements, which includes a range of technologies such as reflective coatings that reduce the amount of heat absorbed or permeable pavements that cool through the evaporation of moisture.
Cool pavements are not a perfect solution, however. For example, reflective pavements redirect energy from the sun upwards, which can actually make temperatures warmer for pedestrians. But when taking many factors into account, cool pavements often have a net positive effect since they can greatly reduce the heat that pavement stores and releases throughout the day.
Similar to cool pavements, cool roofs and green roofs work by reducing the amount of heat that traditional roofing materials absorb, and cooling the surrounding air (in the case of green roofs). Green roofs can cool nearby air temperatures by up to 20°F and reduce the amount of energy required to cool buildings by 70% compared to traditional roof materials.
Although cool and green roofs have higher upfront installation and maintenance costs compared to traditional roofs, they provide many other benefits for water management, air quality, and energy costs.
Community programs help keep people safe
Adapting the built environment is not the only way to combat the urban heat island effect. It’s also important to ensure that people understand the dangers of extreme heat and the resources available to them.
For example, some communities offer cooling centers or outdoor cooling shelters during hot months, providing relief to people without access to safe indoor spaces.
Simple actions like encouraging neighbors to check on each other makes a community more resilient to extreme urban heat.
Education, outreach, and community services are especially important because in many cities the people who face the hottest conditions are the most vulnerable because of systemic economic and social disparities.
And people facing the same heat in the same neighborhood can experience different levels of risk because of health conditions, age, pregnancy, or cooling access and affordability.
Solutions can support communities most affected
Some communities face disproportionate exposure to urban heat.
According to a 2021 study, people of color and those living below the poverty line are disproportionately exposed to urban heat island intensity in 169 of the largest U.S. cities.
Urban heat exposure is also linked to a history of racial discrimination in real estate policies such as a racially biased practice known as redlining in major cities across the U.S.
According to an analysis by the Brown Institute for Media Innovation at Columbia University, in 84% (150 of 179) of U.S. cities, historically redlined areas currently experience hotter summers than areas in the same city that were not historically redlined.
Many of the communities most impacted by UHI may also have fewer resources to address heat burdens. When planning actions to address urban heat, many cities explicitly consider how they can best support the communities most affected.
A range of solutions and responses to urban heat
To address urban heat islands, many cities choose a combination of the solutions described above. A mix of different solutions can help to make sure that communities are addressing the causes of urban heat islands, while also providing more immediate relief to residents.
Some large-scale solutions such as installing cool roofs can have a relatively large cooling effect but may take longer to put in place. Meanwhile, other solutions such as building small shade structures can offer immediate relief.
Climate change is making extreme heat more frequent and intense, and the built environment adds even more heat in cities. Ultimately, rapid and sustained cuts to heat-trapping pollution are essential for creating cooler, safer, more resilient cities.
RELATED RESOURCES
Public Schools in Urban Heat Islands | Climate Central
Here are some “ETs” recorded from around the U.S. the last couple of days, their consequences, and some extreme temperature outlooks, as well as any extreme precipitation reports:
Here is More Climate News from Wednesday:
(As usual, this will be a fluid post in which more information gets added during the day as it crosses my radar, crediting all who have put it on-line. Items will be archived on this site for posterity. In most instances click on the pictures of each tweet to see each article. The most noteworthy items will be listed first.)