The main purpose of this ongoing blog will be to track planetary extreme, or record temperatures related to climate change. Any reports I see of ETs will be listed below the main topic of the day. I’ll refer to extreme or record temperatures as ETs (not extraterrestrials).😜
Here is a new feature for this blog, which I will add daily. This is the latest inciteful Green News Report from my friends Desi Doyen and Brad Friedman at Progressive Voices. Hit ‘continue reading,’ listen, then hit return to see my daily topics:

Green News Report with Brad Friedman & Desi Doyen
Episode: 9/17/2026 — More info…
Main Topic: Another Dire Greenland Ice Sheet Report
Dear Diary. Did you know that the world’s oceans have risen approximately one inch since the 1970s from the melting of Greenland’s ice sheets alone? One inch doesn’t sound like much, but according to a new study compounded with many past reports, that amount will be added to by feet of sea level rise from Greenland as it encounters more climate change warmth during the 21st century. To put it another way, enough ice has melted in Greenland since the 1970s to cover the U.S. with five feet of ice.
Here is that new report from Common Dreams:
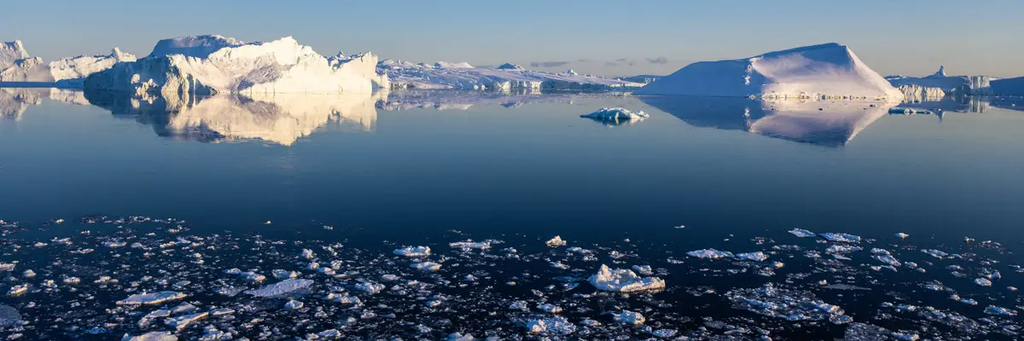
Icebergs, calved from the Sermeq Kujalleq glacier, float in May 2022. (Photo by Thor Wegner/DeFodi Images via Getty Images)
Antarctic, Greenland Sheets Have Melted Enough Since the ‘70s to Cover US in 5 Feet of Ice
“With every additional centimeter of sea-level rise,” the lead author noted, “about 2 to 3 million people are put at risk of annual coastal flooding.”
Sep 16, 2026
Following fresh warnings from scientists about governments not doing nearly enough to cut fossil fuel pollution and what that could mean for the warming planet, an international team of experts on Wednesday published “the most complete picture of ice loss from Greenland and Antarctica to date.”
The polar scientists compared and combined 42 independent estimates derived from satellite observations for Earth’s two main ice sheets to determine their gains and losses from 1972 in Greenland and 1979 in Antarctica until 2023—then released their findings in the journal Scientific Data.
The Associated Press pointed out that it is also “enough frozen water to stack ice 5 feet (1.5 meters) deep across the continental United States.”
The Ice Sheet Mass Balance Inter-comparison Exercise (IMBIE) team found a collective loss of about 11.3 trillion metric tons, or 12.5 trillion US tons.
Inès Otosaka, the professor from England’s Northumbria University who led the study, told Reuters that “to put this very large number into context, 11.3 trillion tons of ice is enough ice to fill in a cube that would be 23 kilometers (14.3 miles) in height.”
The ice loss led to around 3.1 centimeters, or 1.2 inches, of global sea-level rise. Study co-author, IMBIE founder, and Northumbria professor Andrew Shepherd said in a statement that the figure “may sound small, but that puts another 6 to 9 million people at risk of coastal flooding and erosion.”
The study stresses that “since the 1990s, the pace of ice loss from the Antarctic and Greenland ice sheets has accelerated, contributing to the increase in global mean sea-level rise, with the ice sheets now representing almost a quarter of global sea-level rise.”
“Our dataset shows that Antarctic mass loss continues to be dominated by ice discharge from West Antarctica,” the scientists explained, “rising in every decade of our record,” from 29 billion metric tons per year in the 1980s to 163 billion in the 2010s. Across the ice sheet, that rate rose from 48 metric tons in the 1980s to 202 billion in the 2010s. The team estimated that during the study period, Antarctica lost a total of 4.78 trillion metric tons.
“Greenland was close to a state of balance in the 1970s but started to lose mass in the following decades,” they explained. While the ice sheet lost about 60 billion metric tons annually in the 1980s and 57 billion in the 1990s, “losses then accelerated, reaching a rate three times higher in the 2000s,” at 192 billion metric tons, and climbing to 264 billion in the 2010s. Overall, Greenland lost 6,215 trillion metric tons of ice from 1972 to 2023.
TK said that “by reaching back to the 1970s, we can now see how the ice sheets have changed across half a century. More than four-fifths of the ice lost was discharged into the ocean by faster-flowing glaciers, rather than melted at the surface—which tells us the long-term trend is being driven by the dynamic response of the ice sheets to a warming ocean.”
International scientists have previously found that the ocean stores an estimated 91% of the heat from excess greenhouse gases, and the rate of ocean warming has more than quadrupled over the past four decades, as humanity has largely ignored experts’ warnings to urgently phase out fossil fuels.
The new study was released less than two months ahead of the next United Nations Climate Change Conference (COP31) in Türkiye—where recent deadly fires have reignited demands for a swift global transition away from fossil fuels and stronger efforts to prepare vulnerable communities around the world for what UN scientists now warn is an inevitable, but potentially temporary, overshoot of the Paris Agreement’s 1.5°C target for temperature rise this century.
Otosaka told Reuters that “when ice sheets melt, they contribute to rising global sea levels. And with every additional centimeter of sea-level rise, about 2 to 3 million people are put at risk of annual coastal flooding.”
“These findings have implications for coastal planning,” she added, “showing that we urgently need to develop plans for protecting coastal communities around the world from the impact of ice sheet melting.”
Here are some “ETs” recorded from around the U.S. the last couple of days, their consequences, and some extreme temperature outlooks, as well as any extreme precipitation reports:
Here is More Climate News from Thursday:
(As usual, this will be a fluid post in which more information gets added during the day as it crosses my radar, crediting all who have put it on-line. Items will be archived on this site for posterity. In most instances click on the pictures of each tweet to see each article. The most noteworthy items will be listed first.)
The dire Greenland Ice Sheet report is a sobering focus for the September 17 episode, especially as another extreme-temperature diary entry connects the latest findings to the broader climate trend.
The focus on another dire Greenland Ice Sheet report is a sobering reminder that ice loss remains an urgent part of the climate story. The September 17, 2026 episode should prompt closer attention to what these changes mean for future sea-level rise.
The dire Greenland Ice Sheet report is a sobering focus for the September 17th episode, especially as continued ice loss threatens to accelerate sea-level rise. It would be useful to see how this latest report compares with recent melt and mass-balance trends.
The Greenland Ice Sheet report is especially alarming given how quickly ice loss can amplify sea-level rise and other climate feedbacks. The 9/17/2026 episode sounds like an important warning that these changes are accelerating, not stabilizing.
The focus on another dire Greenland Ice Sheet report is a sobering reminder that ice loss is accelerating while political responses remain far too slow. Connecting the latest findings to the wider temperature record makes the stakes especially clear.