The main purpose of this ongoing blog will be to track planetary extreme, or record temperatures related to climate change. Any reports I see of ETs will be listed below the main topic of the day. I’ll refer to extreme or record temperatures as ETs (not extraterrestrials).😜
Here is a new feature for this blog, which I will add daily. This is the latest inciteful Green News Report from my friends Desi Doyen and Brad Friedman at Progressive Voices. Hit ‘More info,’ listen, then hit return to see my daily topics:

Green News Report with Brad Friedman & Desi Doyen
Episode: 11/10/2026 — More info…
U.S. Headed Towards Warmest Year In Recorded History
Dear Diary. No surprise here. The United States is headed towards its warmest year in recorded history. This on top of 2024, which was the warmest year in U.S. history. Climate Change is really ramping up. Only a bone chilling, brutal December can prevent the U.S. from achievement that dubious warm title for 2026.
This is reflected on my record scoreboards. Here is one of my daily record scoreboards. Here we see that 2024 was the warmest year and 2025 4th warmest, but 2026 appears to be even warmer, so far:
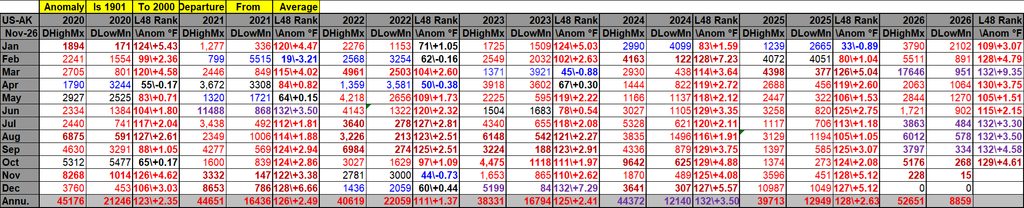
DHMX= Daily High Max Reports. DLMN= Daily Low Min Reports. DHMN= Daily High Min Reports. DLMX=Daily Low Max Reports.
Boldly highlighted red, blue, or purple colored months, such as December 2023 and June 2021, that have ratios of >10 to 1 daily or <1 to 10 of daily warm to low records are either historically hot or cold, most of which have made news. NCEI rankings are for the lower 48 states with the warmest ranking since 1895 of average temperatures being 132 and 1 being the coldest as of 2026. Blue colors represent cold months and red warm. Those months and years with counts close to a 1 to 1 ratio of highs to lows are colored black. All-time record hottest or coldest months and years are boldly colored in purple. NCDC rankings have been color coded (under tabs in each file) such that values of 55 to 75 are black representing neutral months or years (+ or – 10 from the average ranking of 64).
Here are more details from my friend Bob Henson writing for Yale Climate Connections:
Heat and high water: Floods pockmarked southern U.S. states during one of the hottest Octobers on record
The Four Corners area was especially hard hit by relentless rounds of heavy rain, while record-high tides sloshed onto coastlines in California and Florida.

by Bob Henson
November 9, 2026

Pedestrians walk through a flooded street caused by king tides and heavy rain Wednesday, Oct. 28, 2026, in North Bay Village, Fla. (AP Photo/Marta Lavandier)
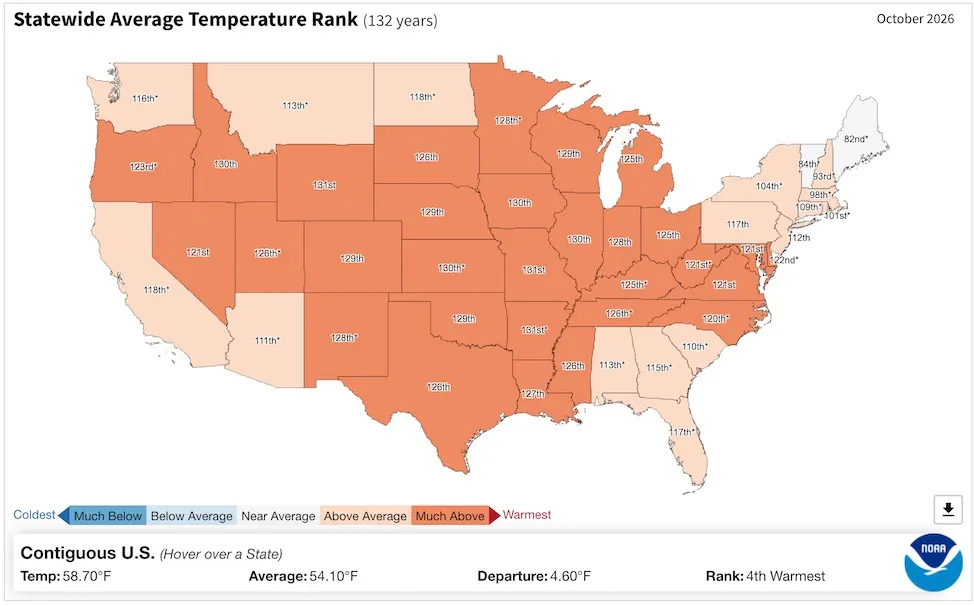
Figure 1. Statewide temperature averages for October 2026. The rankings shown for each state ascend from coolest to warmest for the 132 years of recordkeeping, so “132nd” denotes the warmest October on record and “1st” denotes the coolest. (Image credit: NOAA/NCEI)
October 2026 was the fourth warmest in 132 years of recordkeeping for the contiguous 48 U.S. states, NOAA’s National Centers for Environmental Prediction reported on Monday. This was a microscopic cooldown at best in the wake of July, August, and September (plus March) all having set monthly U.S. heat records. The only warmer Octobers in U.S. history were in 1963, 2024, and 1947.
October’s U.S. warmth was remarkably uniform from coast to coast and from the Mexican to Canadian border, as shown in Fig. 1 above. Of the 48 contiguous states, all but two were warmer than average, and 32 of the 48 were “much above average”, meaning they ranked in the warmest 10% of all Octobers. No state had its warmest October, but Arkansas and Missouri saw their second-warmest October on record, and 12 other states were among the top five warmest.
Although October wasn’t record-warm nationwide, the first 10 months of 2026 were the nation’s hottest Jan.-Oct. ever recorded. In fact, the 10-month average of 59.19°F was almost a full degree Fahrenheit warmer than the 58.34°F from Jan.-Oct. 2012. That’s a hefty margin for a nationally compiled long-term statistic like this.
Unless November and December are surprisingly chilly, 2026 appears destined to end up as the nation’s hottest year on record. This will happen if November and December together average at least 37°F – a threshold that’s been surpassed every year in this century except for 2013.
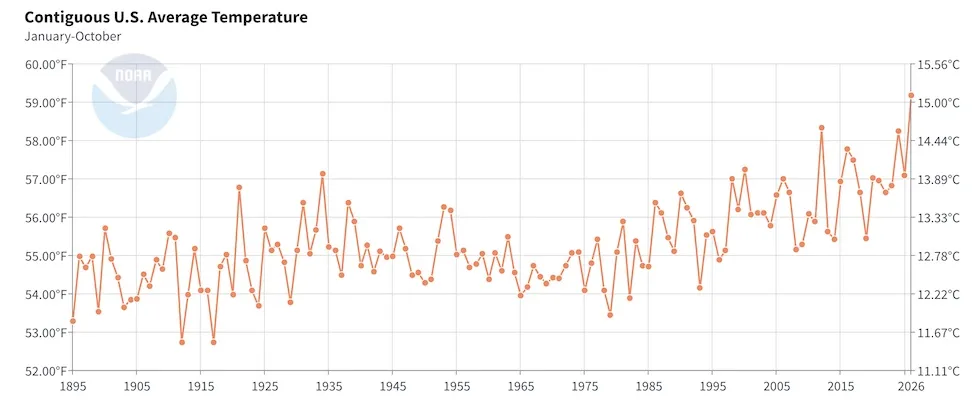
Figure 2. Average temperature across the contiguous 48 U.S. states for each January-through-October period from 1895 through 2026. (Image credit: NOAA/NCEI)
Too much and too little water: The drought-deluge contrasts intensify in October
When pulled together for the nation as a whole, October wasn’t a standout month for precipitation: it came in as 51st-wettest across 132 years of data. However, Fig. 3 below suggests how much is hidden behind that number.
A total of 22 states were drier than average. Most dramatically, Mississippi had its 13th-driest October on record. Yet the overall extent of U.S. drought dropped notably in October. According to the U.S. Drought Monitor, the fraction of the contiguous U.S. covered by severe to exceptional drought decreased from around 31% on October 6 to around 23% on October 3.
Meanwhile, although just 11 states were wetter than average in October, these included most of the larger southwest and south-central states. Arizona, Colorado, Nevada, and Utah each had a top-ten-wettest October, as did Florida, largely due to torrential episodes of flooding rain that struck each state.
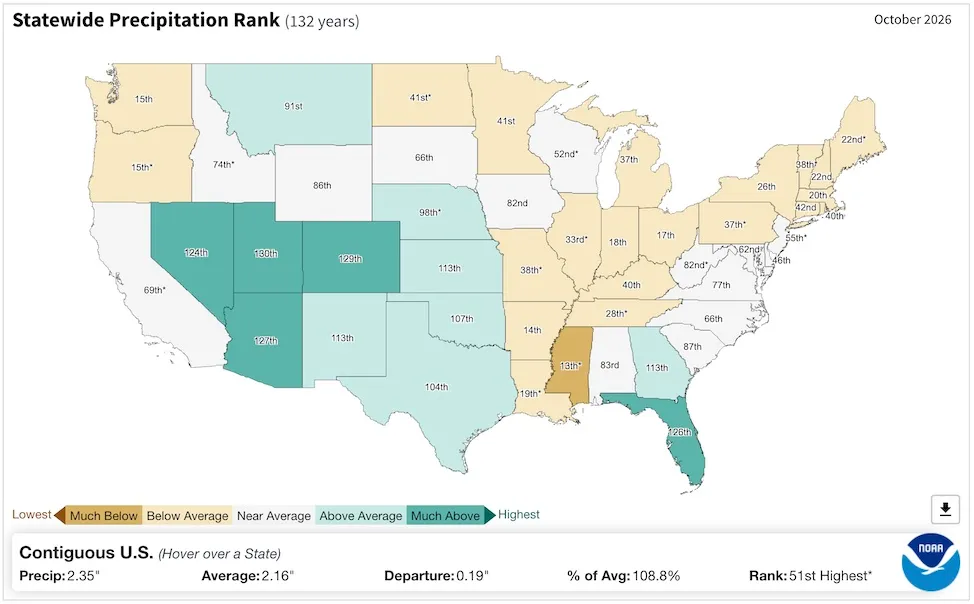
Figure 3. Statewide precipitation averages for October 2026. The rankings shown for each state ascend from driest to wettest for the 132 years of recordkeeping, so “132nd” denotes the wettest October on record and “1st” denotes the driest. (Image credit: NOAA/NCEI)
Colorado state climatologist Russ Schumacher referred to the Oct. 21-25 rains that struck normally arid regions such as the San Luis Valley as “among the most extreme storms in state history” and said the destruction has been “immense.” The Land Desk, a Substack feed that’s been covering the record Four Corners river crests extensively, noted one stark example: The Piedra River, a tributary of the San Juan River, hit streamflow rates more than twice as large as any others in data going back to 1964.
Among the region’s hardest-hit areas is the Navajo Nation, the largest sovereign tribal nation within U.S. borders. It covers most of northwest New Mexico and northeast Arizona, along with far southeast Utah, and includes some 173,000 residents. Multiple episodes of flood-inducing rainfall have hammered the region since mid-September, in many cases worsened by moisture carted inland from decaying hurricanes spawned by the Eastern Pacific’s record-busy tropical season. Many homes were damaged, and many roads remain mud-caked. In a TV interview, Navajo Nation President Buu Nygren said total damage will likely far exceed a $20 million fund established on October 30 to pay for road and home repairs and related equipment.
Another big problem in October was record- and near-record-high water levels along the coasts of southern California and Florida, driven by a mix of long-term warming and ocean expansion, persistent onshore winds, and astronomical “king tides” that are unusually large this autumn.
Among the landmarks set in October, as compiled by Jeff Masters:
- The morning high tide on Oct. 26 brought the highest coastal water levels in over a century of record-keeping to both San Diego and Los Angeles, according to preliminary data from NOAA. Of the top-10 water levels on record for California’s three largest coastal cities, eight out of 30 entries are now from 2026.
- Miami, FL, set a record-long streak of 11 days, ending on Nov 1, with coastal waters reaching the “Moderate” flooding threshold. Since Miami’s tide gauge was installed in 1994 at Virginia Key, four of the top water levels on record occurred during the October 2026 king tides, with 60% of the top 15 readings occurring during king tides over the past two years. Sea level rise has drastically increased the probability of coastal flooding in Miami, where sea level has increased by about 1.12 feet since 1931. In fact, what would have been a one-in-10-year flood in 1931 (1.33 feet above high tide, or MHHW) has already occurred on 24 days during the period Sep. 25 – Nov. 2, with many more days to come.
Jeff Masters and Irene Sans contributed to this post.
Bob Henson
Bob Henson is a meteorologist and journalist based in Boulder, Colorado. He has written on weather and climate for the National Center for Atmospheric Research, Weather Underground, and many freelance… More by Bob Henson
Bob Henson’s “Heat and high water: Floods pockmarked southern U.S. states during one of the hottest Octobers on record” was first published on Yale Climate Connections, a program of the Yale School of the Environment, available at: http://yaleclimateconnections.org. This work is licensed under a Creative Commons Attribution-Noncommercial-No Derivative Works 2.5 license (CC BY-NC-ND 2.5).
Here are some “ETs” recorded from around the U.S. the last couple of days, their consequences, and some extreme temperature outlooks, as well as any extreme precipitation reports:
Here is More Climate News from Wednesday:
(As usual, this will be a fluid post in which more information gets added during the day as it crosses my radar, crediting all who have put it on-line. Items will be archived on this site for posterity. In most instances click on the pictures of each tweet to see each article. The most noteworthy items will be listed first.)