Made November 2026
The purpose of this post is to catalogue counts of monthly records (record high maximums, record high minimums, record low minimums, record low maximums) for India coming into the National Centers for Environmental Information’s site and all related charts and graphs produced in my Excel files for those data sets. For example, the highest temperature set during the month of March at Atlanta Hartsville-Jackson Airport was 89F set on 3/23/1995. I continue to update these data as part of my long-term work examining the warm-record/cold-record relationships first studied in the 2009 Meehl et al. paper published in Geophysical Research Letters, research that I helped initiate during 2000–2009. Each individual count could be a report of a tied surface record or one broken by several degrees Fahrenheit. Here is the link to the NCEI site:
https://www.ncdc.noaa.gov/cdo-web/datatools/records
More from NCEI:
“The daily records summarized here are compiled from a subset of stations in the Global Historical Climatological Network. A station is defined as the complete daily weather records at a particular location, having a unique identifier in the GHCN-Daily dataset.
For a station to be considered for any parameter, it must have a minimum of 30 years of data with more than 182 days complete each year. This is effectively a “30-year record of service” requirement, but allows for inclusion of some stations which routinely shut down during certain seasons. Small station moves, such as a move from one property to an adjacent property, may occur within a station history. However, larger moves, such as a station moving from downtown to the city airport, generally result in the commissioning of a new station identifier. This tool treats each of these histories as a different station. In this way, it does not “thread” the separate histories into one record for a city.
This tool provides simplistic counts of records to provide insight into recent climate behavior, but is not a definitive way to identify trends in the number of records set over time. This is particularly true outside the United States, where the number of records may be strongly influenced by station density from country to country and from year to year. These data are raw and have not been assessed for the effects of changing station instrumentation and time of observation.”
All counts include ties of records.
An updated 2016 study from Dr. Jerry Meehl indicates that the ratio from year to year will average around 15 to 1 by 2100 for the United States:
Per one of the authors of both the 2009 and 2016 studies, Claudia Tebaldi said “This climate is on a trajectory that goes somewhere we’ve never been. And records are a very easy measure of that.”
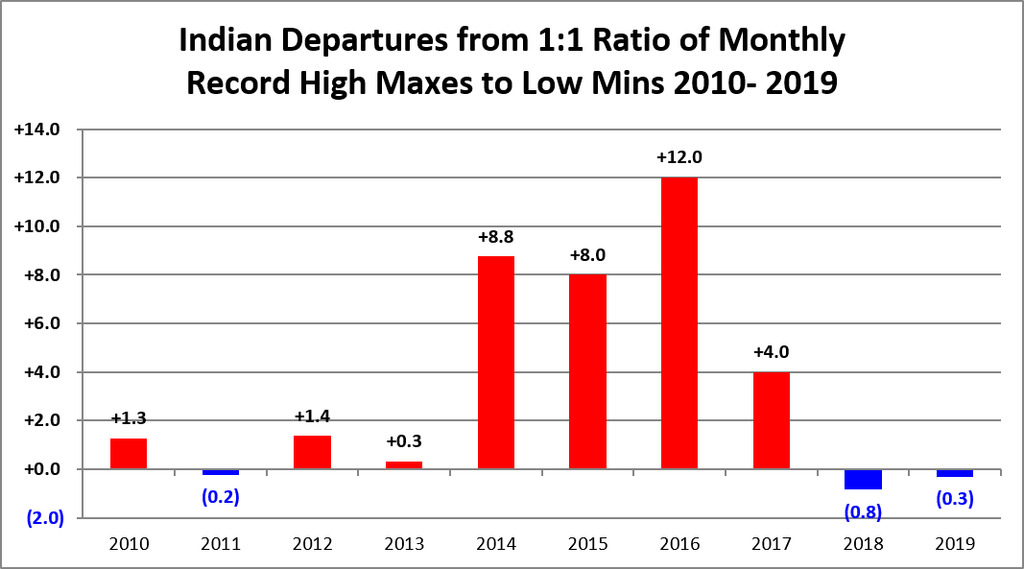
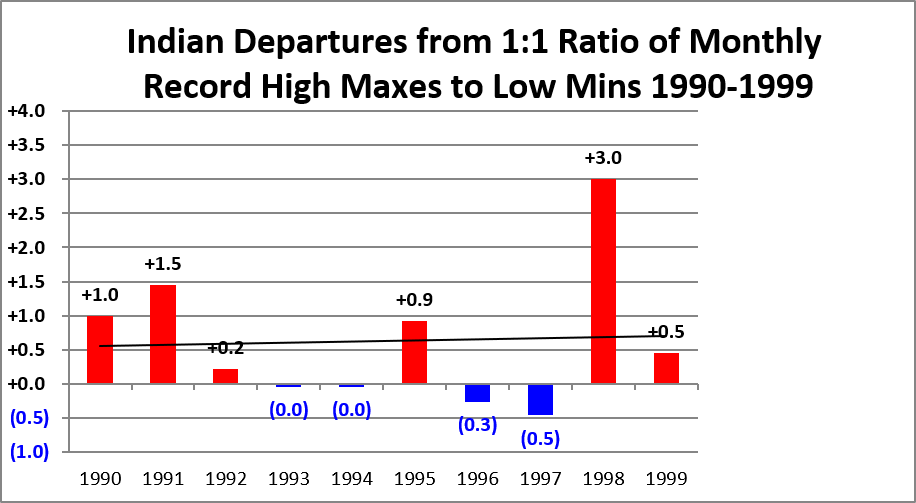
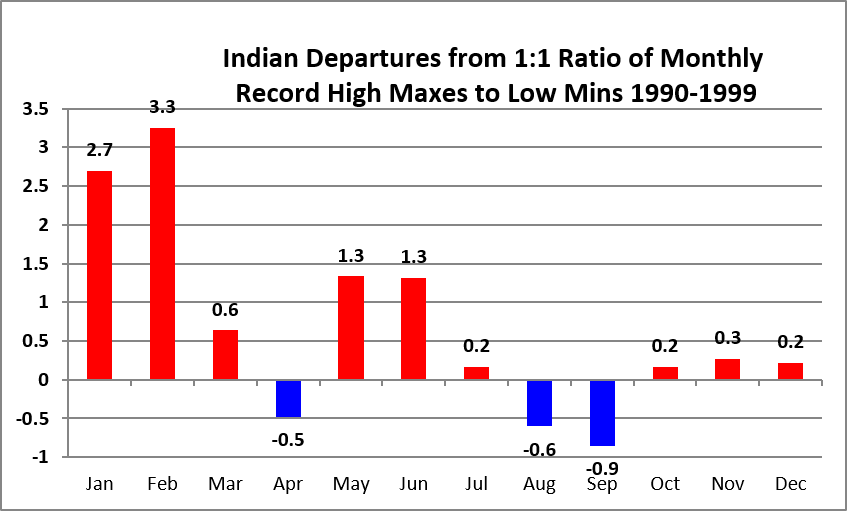
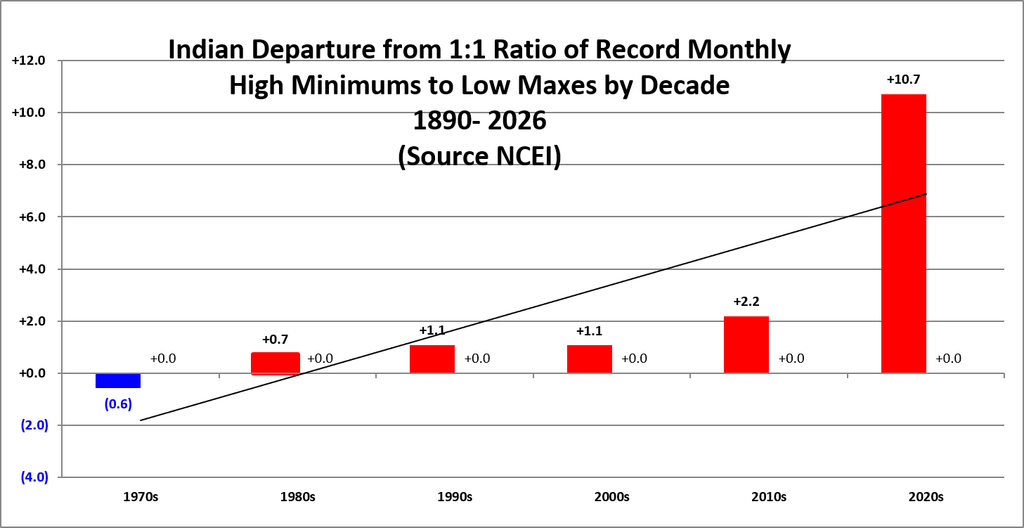
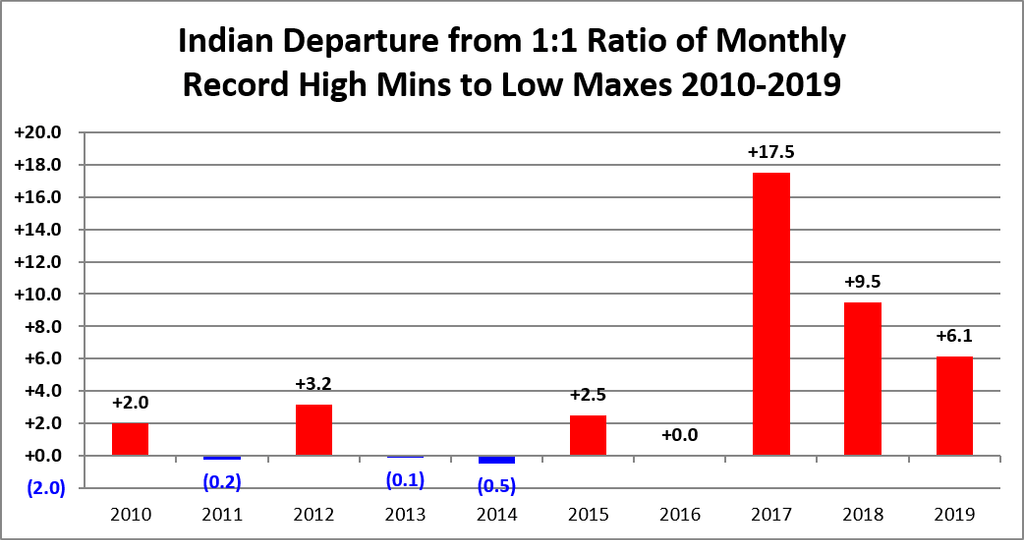
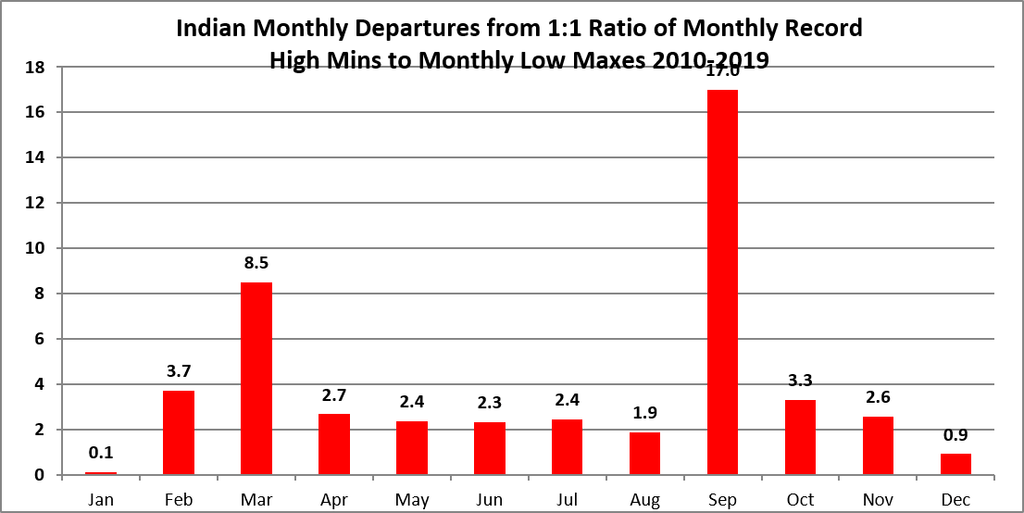
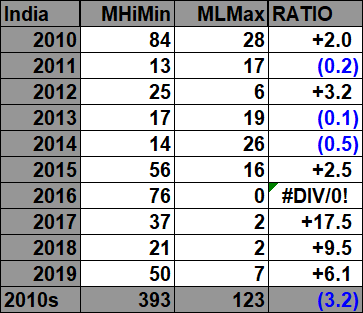
All of the data listed below is part of this one chart. So far, the ratio of monthly record high maxes to low minimums for the 2010s is higher than any other decade since the 1970s:
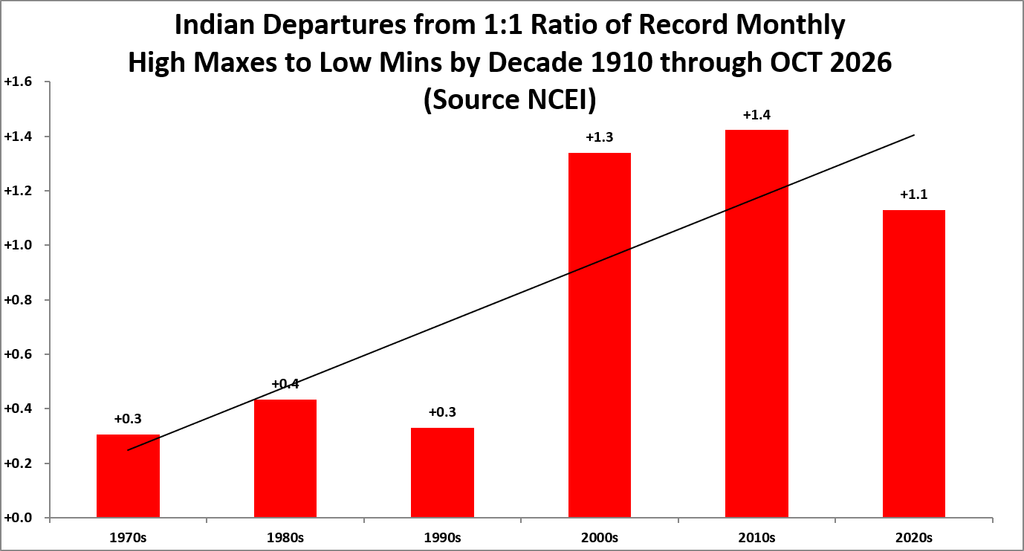
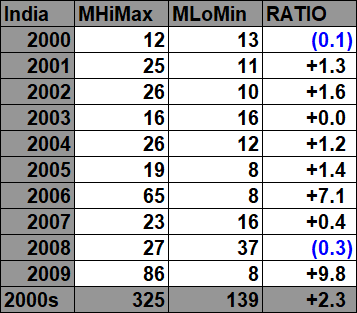
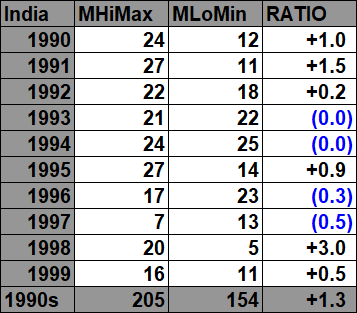
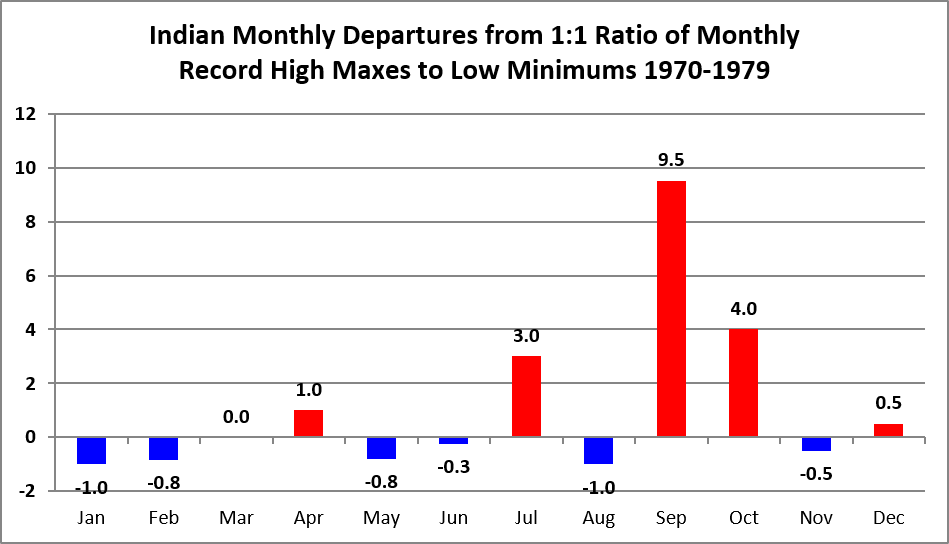
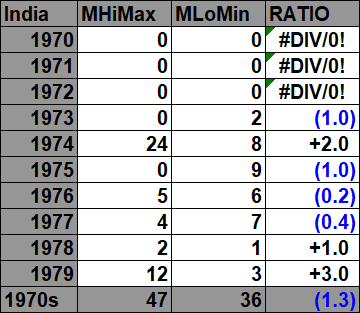
Here are the current monthly record counts per decade, which have gone into the prior chart:

Scientific Assessment of India’s Monthly Temperature-Record Analysis
Our Indian analysis reveals a strong and scientifically meaningful relationship between monthly temperature anomalies and the frequency of record-breaking warmth and cold.
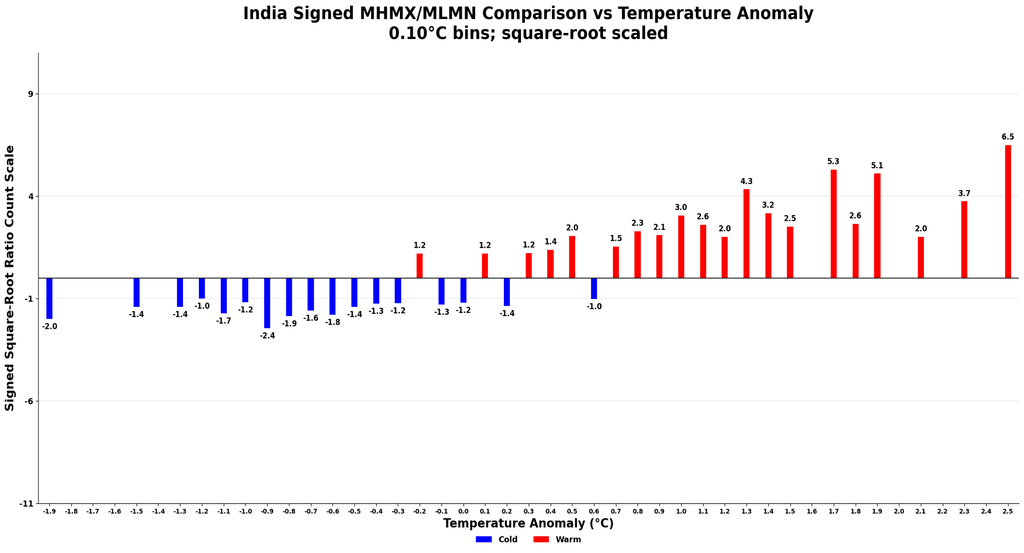
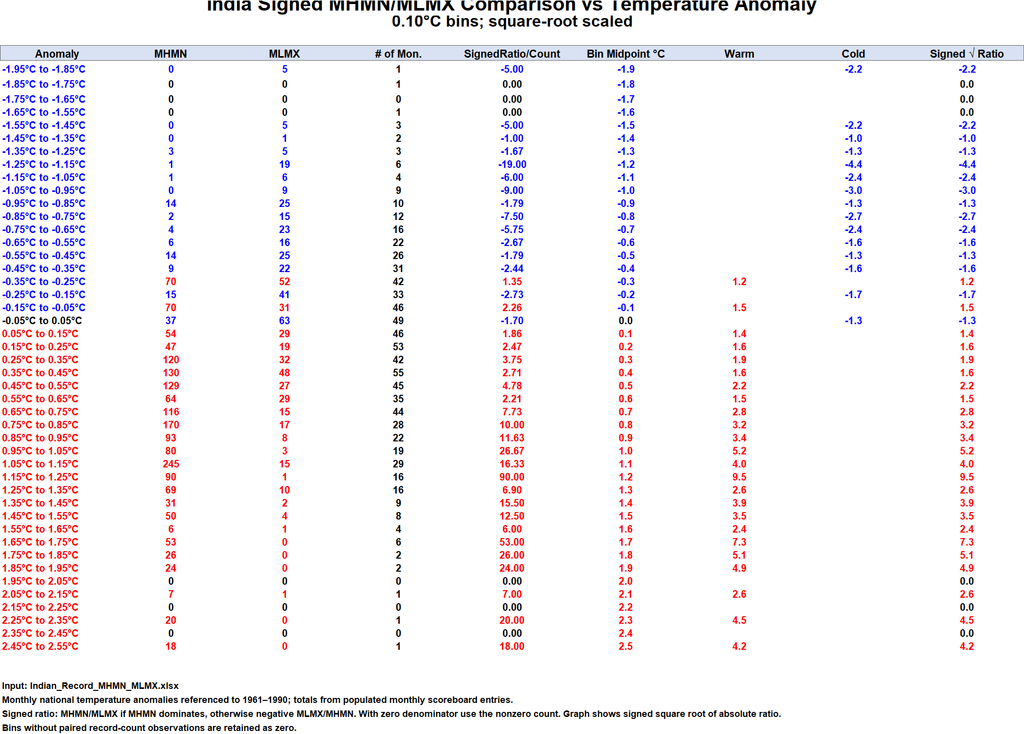
Using temperature anomalies relative to the 1961–1990 climatological baseline, grouped into 0.10°C increments, we find that the farther monthly temperatures depart from their historical average, the more strongly temperature records tend to favor the direction of that departure. The relationship exhibits a pronounced nonlinear pattern consistent with findings from China, Australia, Germany, Canada, the United States, and the other countries investigated.
The results are particularly striking for the two categories of Indian monthly temperature records:
| Monthly record comparison | Anomalies ≥ +2°C | Anomalies ≤ −1°C |
| MHMX / MLMN | ~60.0 warm records per cold record | ~3.8 cold records per warm record |
| MHMN / MLMX | ~45.0 warm records per cold record | ~10.0 cold records per warm record |
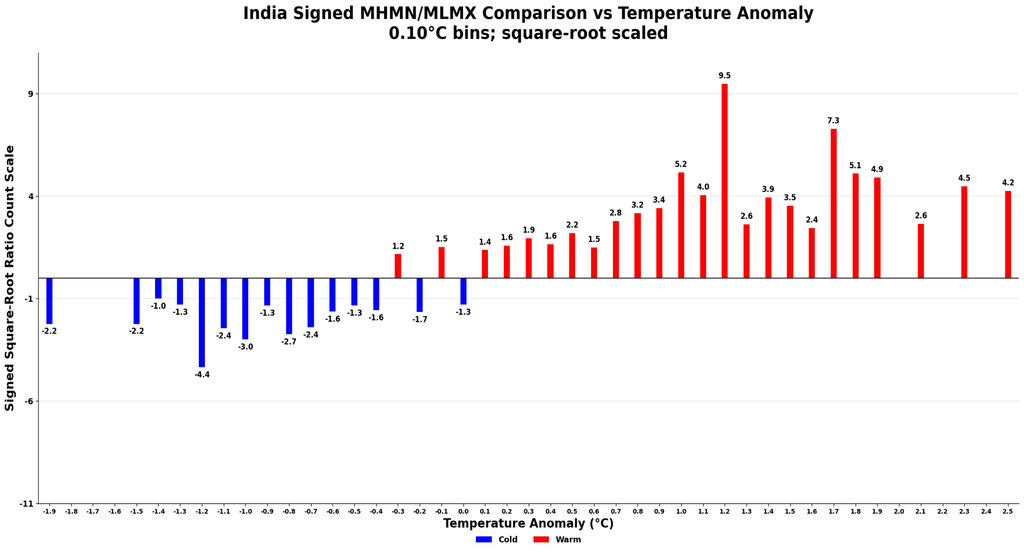
These results indicate that exceptionally warm Indian months strongly favor new monthly warm-temperature records, while substantially colder-than-normal months favor monthly cold records. The reversal is especially pronounced in the MHMN/MLMX comparison at negative anomalies, where monthly low maximums outnumber monthly high minimums by approximately 10 to 1 at anomalies of −1.0°C and colder.
At anomalies of +2.0°C or greater, the MHMX/MLMN comparison produces 60 warm records versus only 1 cold record, while the MHMN/MLMX comparison produces 45 warm records versus only 1 cold record. These are extremely large warm-to-cold ratios, although only three months in the analyzed period fall into this exceptionally warm category. The magnitude of these ratios therefore should be interpreted alongside the very small sample size.
An important finding is that the imbalance becomes much smaller near climatological normal. During months with anomalies within approximately ±0.5°C of the 1961–1990 average, the MHMX/MLMN comparison produces 394 warm records and 338 cold records, a ratio of approximately 1.17 to 1. The MHMN/MLMX comparison produces 695 warm records and 389 cold records, approximately 1.79 warm records for every cold record. Warm records therefore remain more numerous near normal, particularly for monthly minimum temperatures, but the imbalance is much smaller than during exceptionally warm months.
The cold side of the distribution provides an equally important reversal. At anomalies of −1.0°C and colder, monthly record low minimums outnumber monthly record high maximums by 19 to 5, or approximately 3.8 to 1. Monthly record low maximums outnumber monthly record high minimums by 50 to 5, or 10 to 1. Thus, when the background climate becomes sufficiently cold relative to the 1961–1990 baseline, the record imbalance reverses decisively toward cold extremes.
India contains no analyzed months with anomalies of −2.0°C or colder, so a meaningful extreme-cold comparison equivalent to the +2.0°C warm category cannot be made. The −1.0°C-and-colder threshold therefore provides the most useful measure of the cold tail of the Indian distribution.
Across the complete Indian monthly dataset, warm records outnumber cold records in both comparisons:
- MHMX/MLMN: 990 warm records versus 522 cold records, approximately 1.90 to 1.
- MHMN/MLMX: 1,888 warm records versus 624 cold records, approximately 3.03 to 1.
These aggregate results demonstrate a substantial predominance of monthly warm-temperature records in India’s available observational record, with the strongest overall imbalance occurring in monthly high minimum temperatures relative to monthly low maximum temperatures.
Scientific interpretation
These findings are consistent with the expected statistical consequences of a warming climate. As the temperature distribution shifts toward higher values, opportunities to exceed previous warm-temperature extremes increase, while opportunities to establish new cold-temperature extremes generally diminish. Conversely, months that remain substantially colder than the climatological baseline continue to strongly favor cold records.
One especially interesting feature of India’s results is the behavior of minimum temperatures. Across the full dataset, MHMN records outnumber MLMX records by approximately 3.03 to 1, compared with an MHMX/MLMN ratio of approximately 1.90 to 1. This suggests that the warm-record shift has been particularly pronounced the warm-record imbalance has been particularly pronounced for monthly minimum temperatures. Such a difference could reflect changes in nighttime temperatures, humidity, cloud cover, land-surface conditions, atmospheric circulation, urbanization, or other regional processes. Determining the relative contribution of these mechanisms would require additional physical and statistical analysis.
At the most extreme positive anomalies, however, the MHMX/MLMN ratio of approximately 60 to 1 exceeds the MHMN/MLMX ratio of approximately 45 to 1. Because these values are derived from only three months, this difference should not be interpreted as evidence that daytime extremes respond more strongly than nighttime extremes under exceptionally warm conditions. The small number of observations makes the extreme warm bins particularly sensitive to individual months.
India’s results are valuable because they reproduce the same broad relationship observed across countries with very different climates, geography, station networks, and observational histories. Near the climatological mean, warm and cold records are comparatively balanced. As anomalies become increasingly positive, warm records rapidly dominate. As anomalies become increasingly negative, the relationship reverses and cold records dominate. This recurring pattern across independent national datasets strengthens the broader international picture of shifting temperature extremes.
Several limitations must be considered. India’s usable NCEI record-count history begins primarily in the 1970s, with meaningful reporting appearing from about 1973 onward. The record-count period is therefore shorter than those available for several other countries examined in this investigation. Recent observations may also be incomplete or provisional, and differences in station density, geographic coverage, historical record length, and reporting practices can influence the number of record-setting opportunities.
The most extreme anomaly categories contain relatively few months. Ratios derived from those categories can consequently become very large when only one or a few cold records occur. These ratios accurately describe the available observations but should be considered alongside the number of months and records contributing to each bin. The square-root transformation used in the accompanying graphs improves visual readability but does not establish statistical significance.
This analysis is observational rather than a formal attribution study. It does not by itself demonstrate that a particular forcing caused individual records. Nevertheless, the strong correspondence between independently processed monthly temperature-anomaly data and NCEI monthly record counts provides compelling descriptive evidence that the background thermal state is closely associated with the balance between record-setting warmth and cold.
Overall assessment: India’s monthly temperature-record analysis provides compelling descriptive evidence that the background thermal state is strongly associated with the balance between warm and cold temperature records. Its most important finding is the clear nonlinear transition from cold-record dominance during substantially negative anomalies, through much closer balance near climatological normal, to overwhelming warm-record dominance during exceptionally warm months. The particularly strong overall predominance of monthly high-minimum records adds an important dimension to the analysis, while the consistency of the Indian results with those from China and other countries strengthens the broader international evidence of shifting temperature extremes in a warming climate.
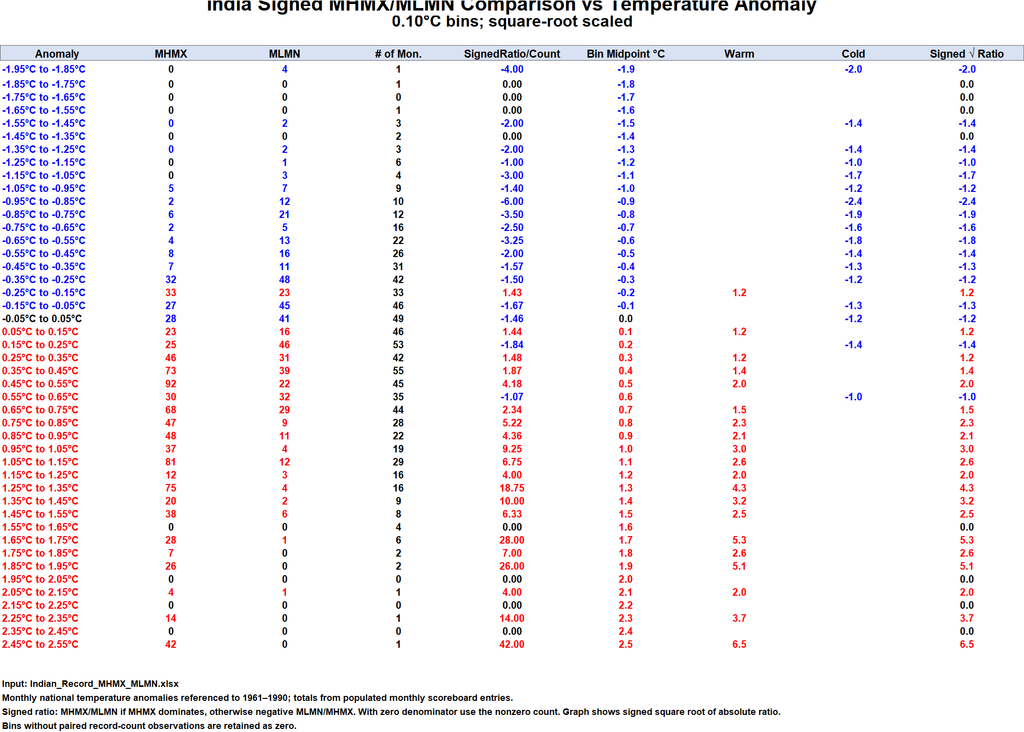
To better quantify the relationship, monthly anomalies were grouped into 0.10°C bins. Within each bin, warm-record and cold-record counts were compared using a signed ratio, then square-root scaled for display so that both large warm and cold imbalances remain readable on the same graph.
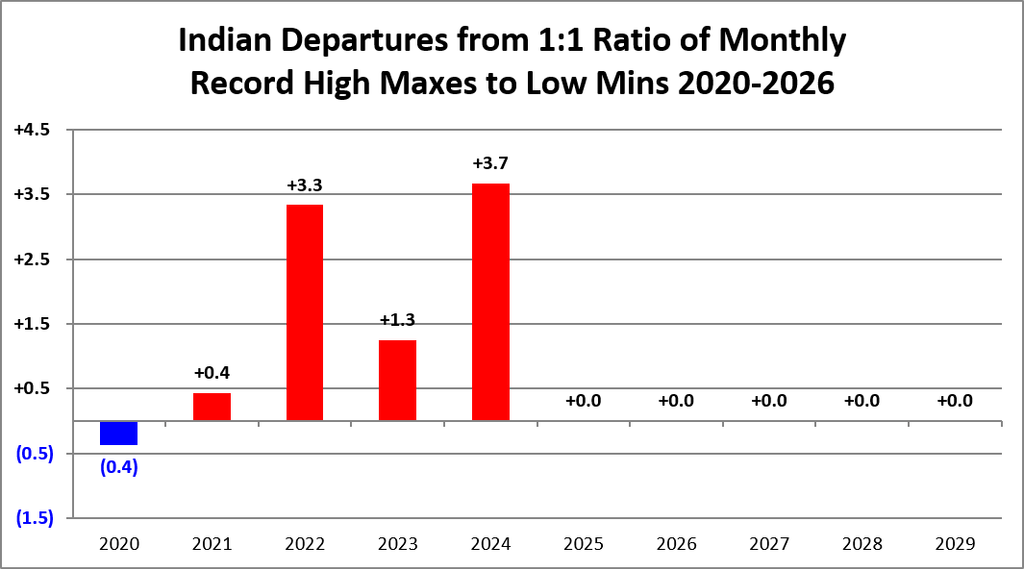
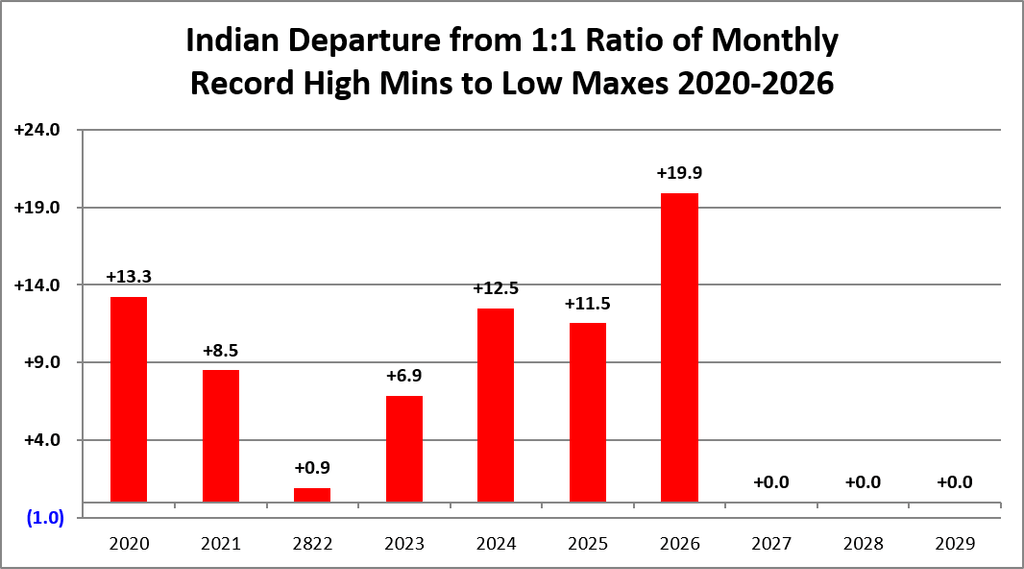
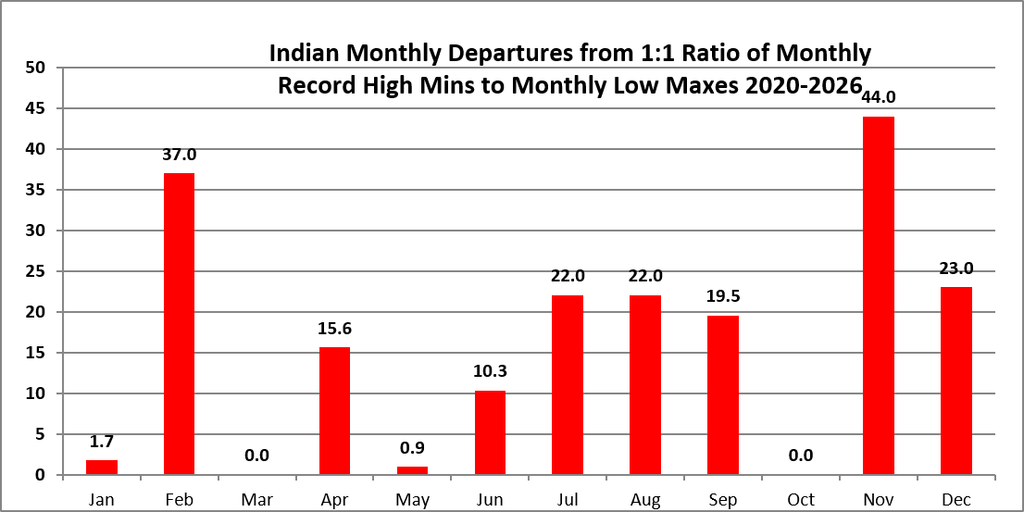
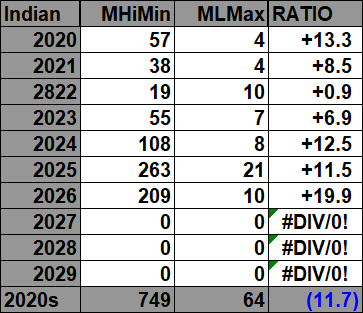
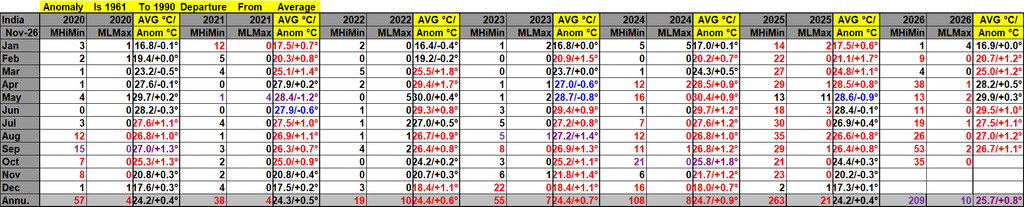
The 2020s:
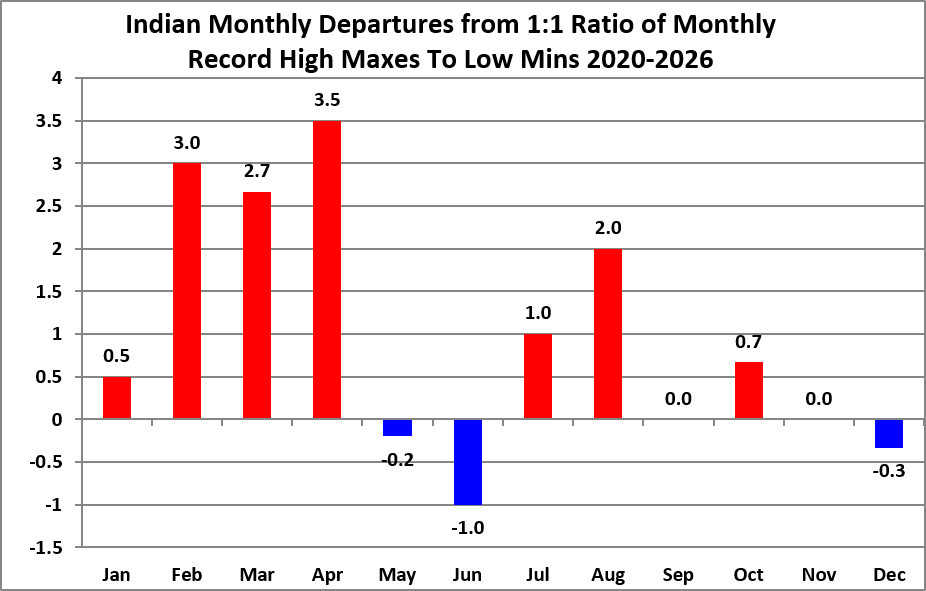
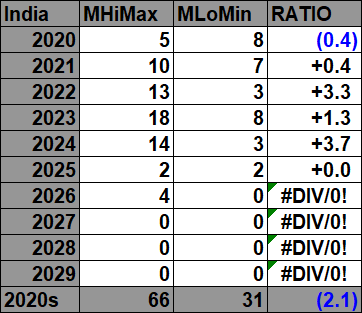
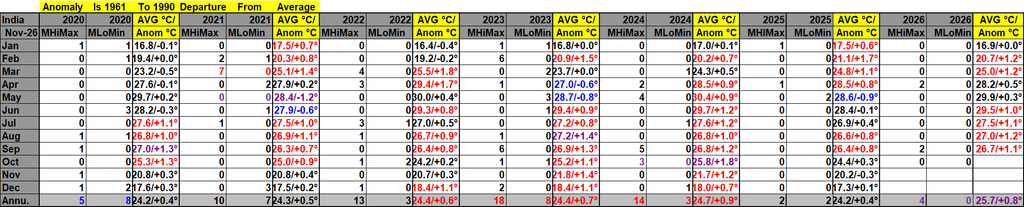
Blue colors represent colder months and red warmer. Months and years that are all-time record cold or hot are colored purple. Temperature anomalies greater than +0.5°C are shown in red, while anomalies below −0.5°C are shown in blue. Values within ±0.5°C are shown in black. All-time warmest and coldest months and years are highlighted in purple. Record-count ratios are displayed separately using the established warm-versus-cold comparison. I have opted not to catalogue data prior to 1970 since record counts decrease substantially prior to the decade of the 1970s. Time stamps for when I last updated counts are located in the upper left-hand corner of each chart. Drop me a note if you see an error or if you have suggestions for improvements.
The 2010s:
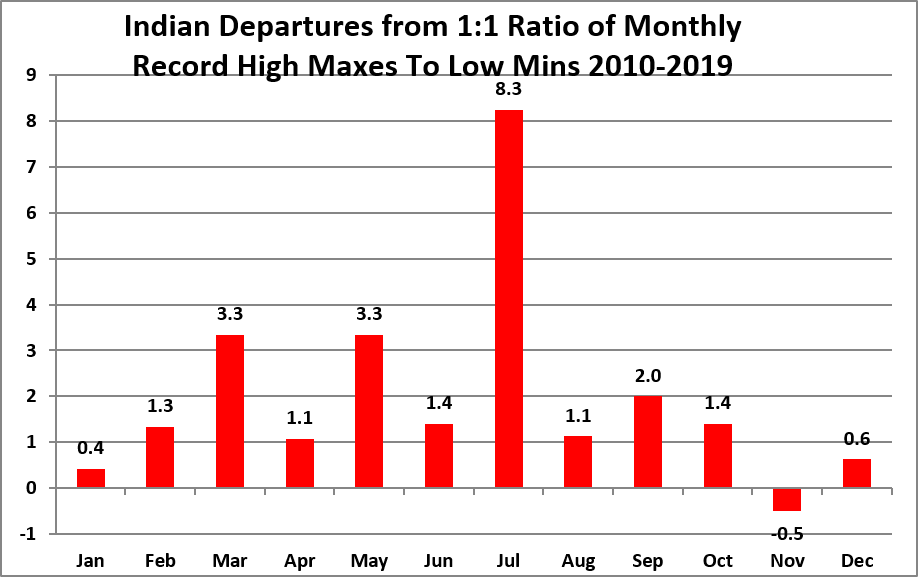
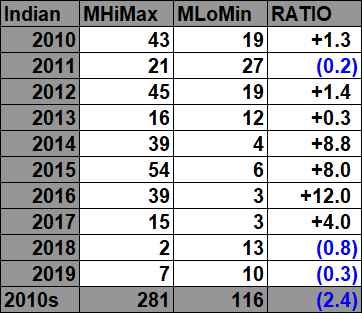

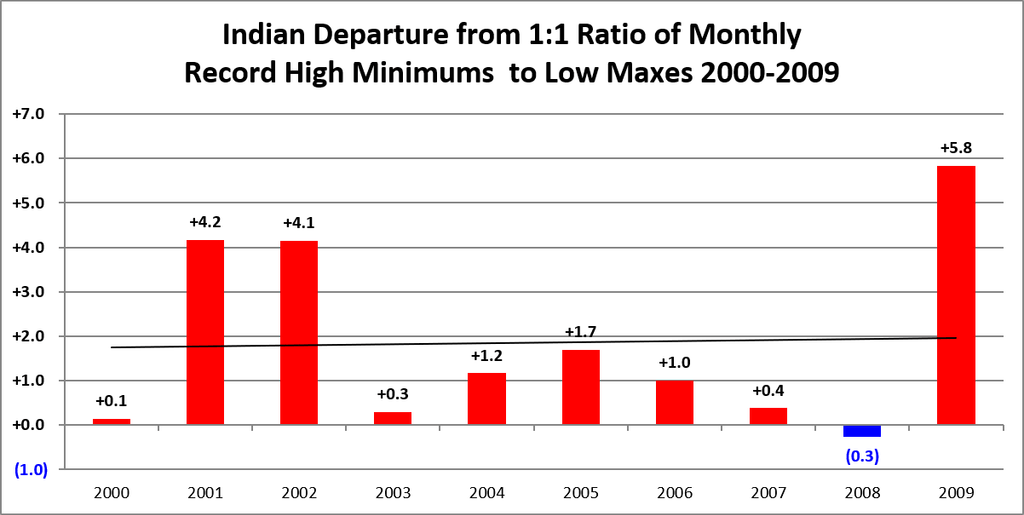
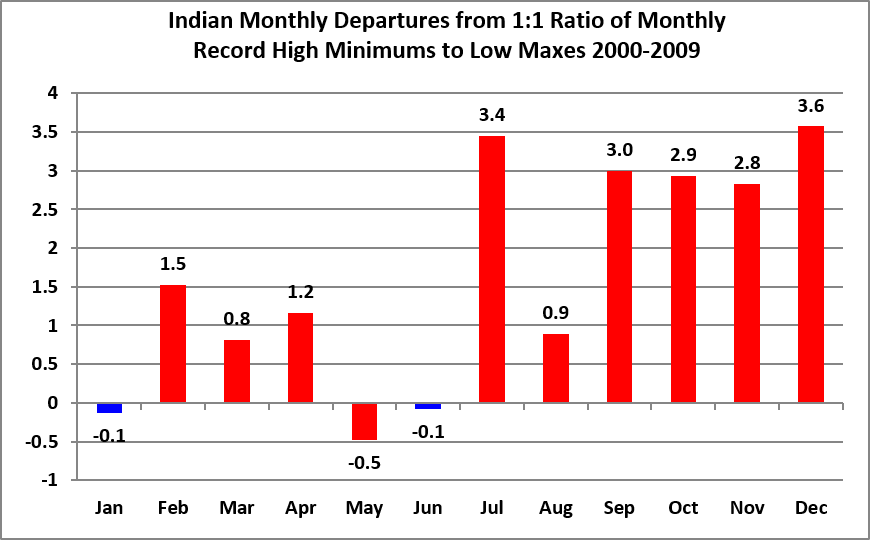
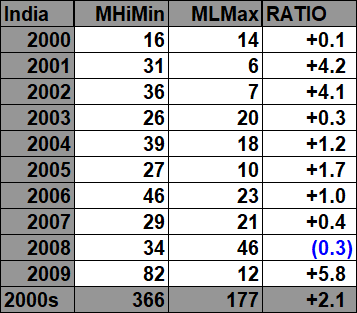
The 2000s:
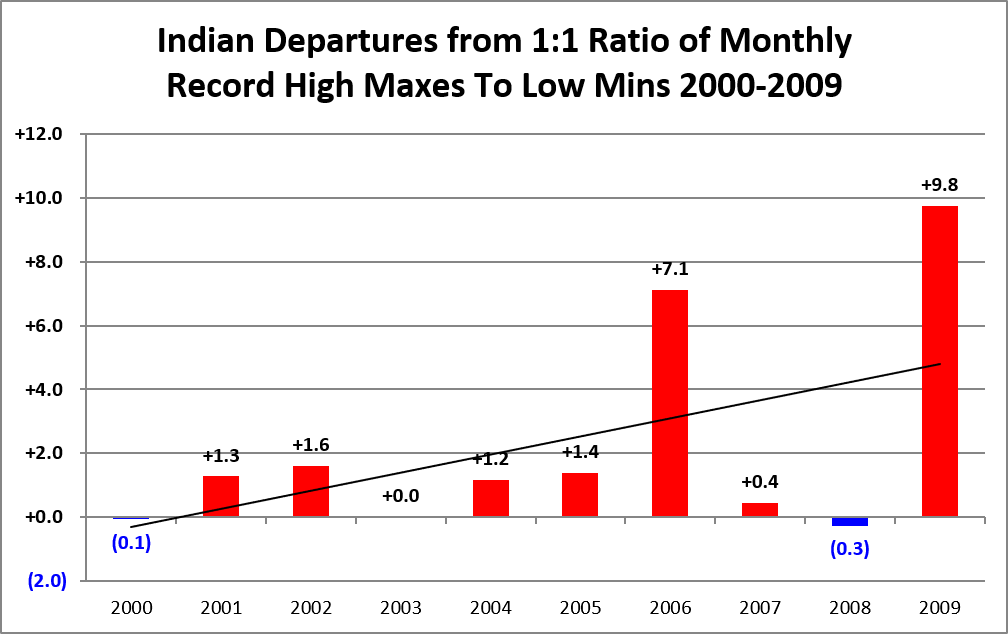
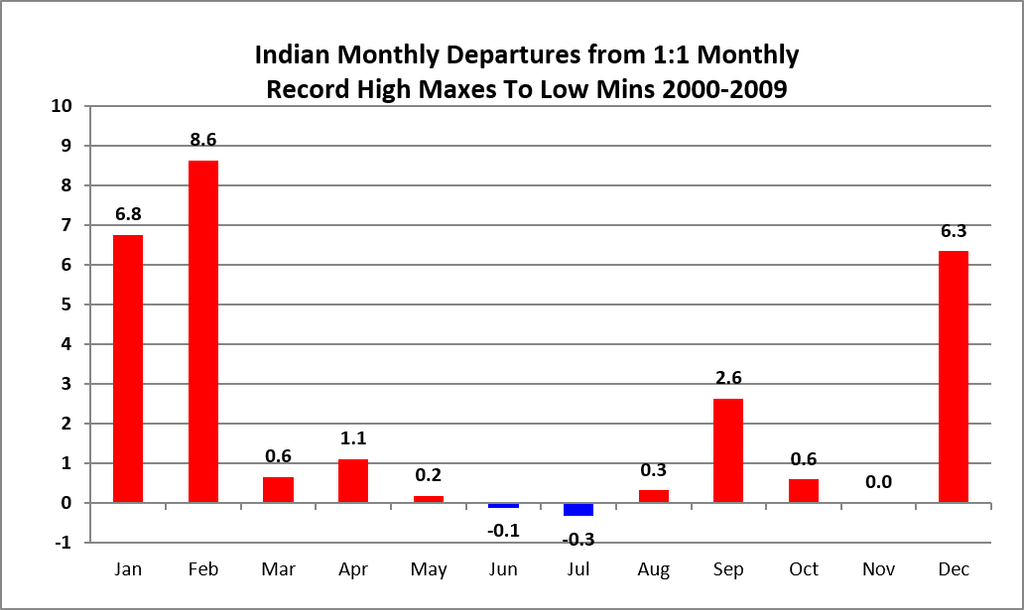

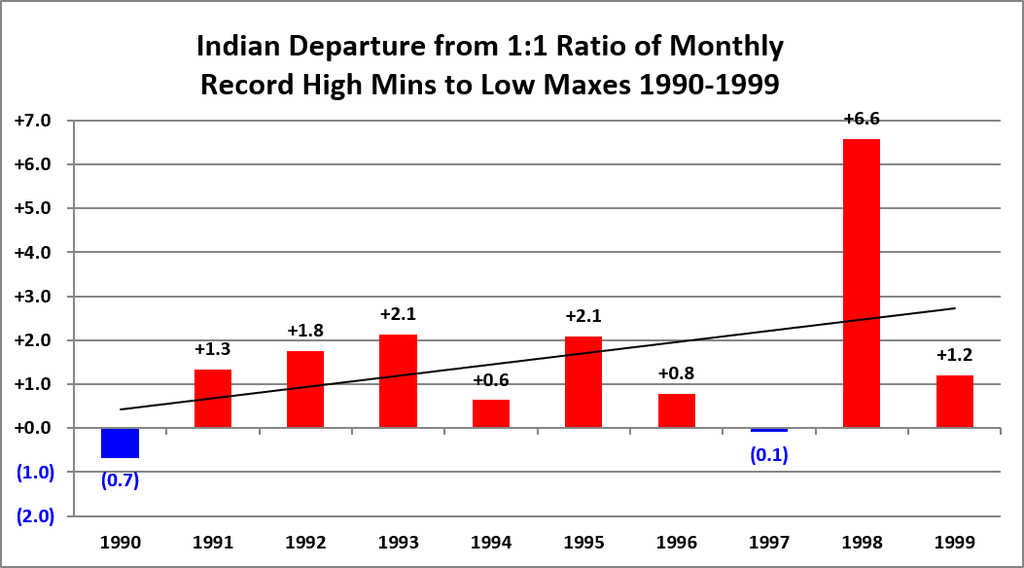
The 1990s:

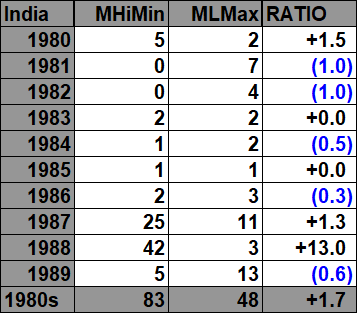
The 1980s:
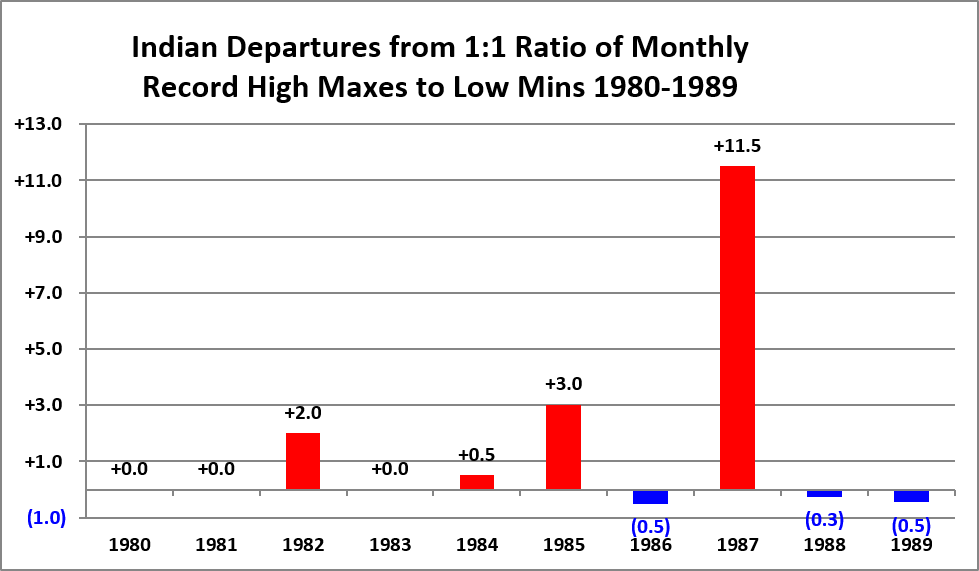
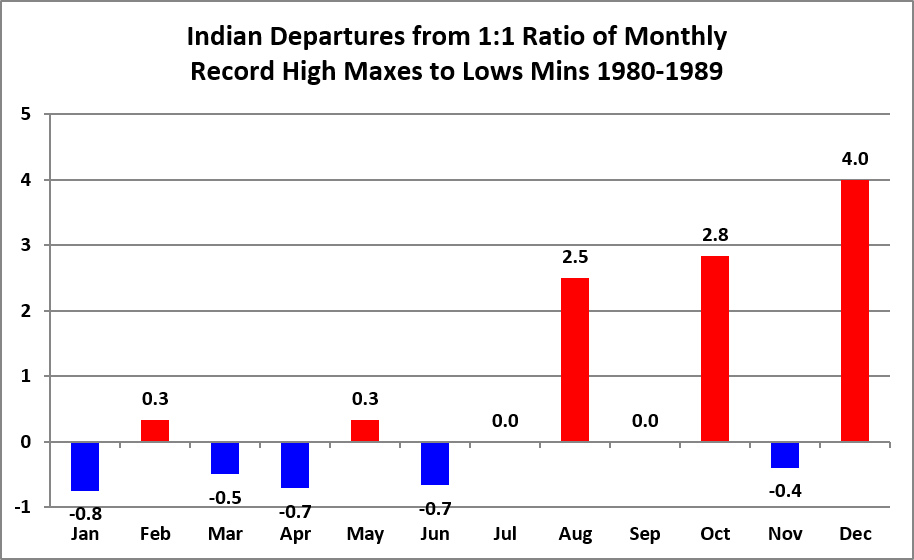
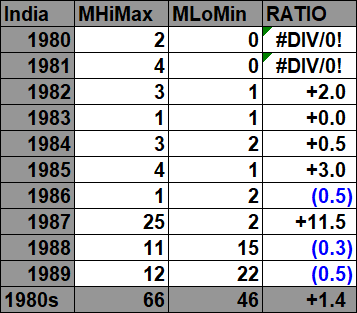

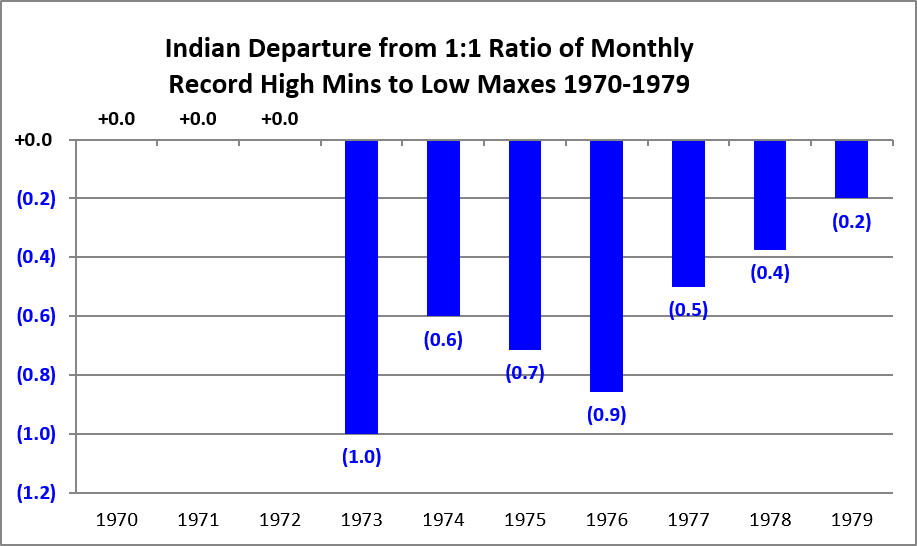
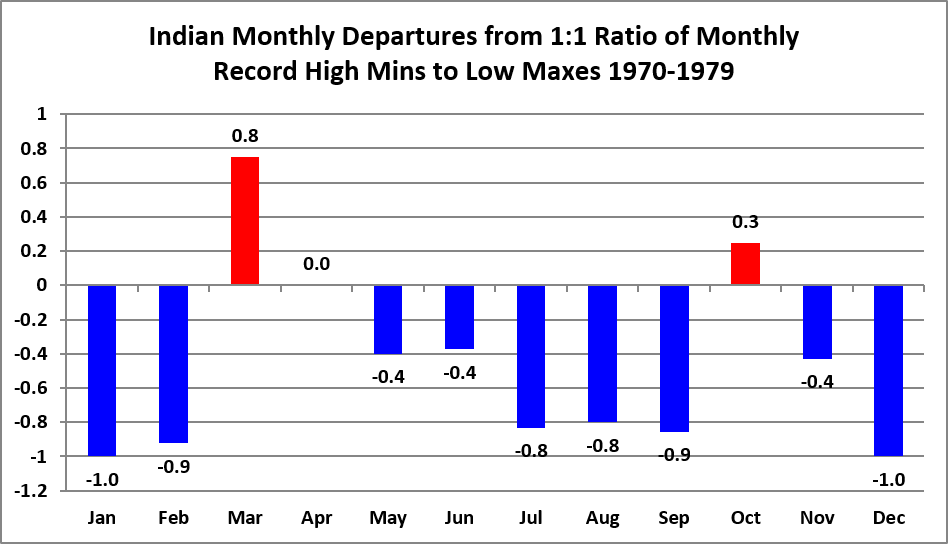
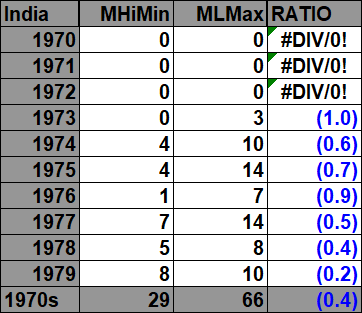
The 1970s:
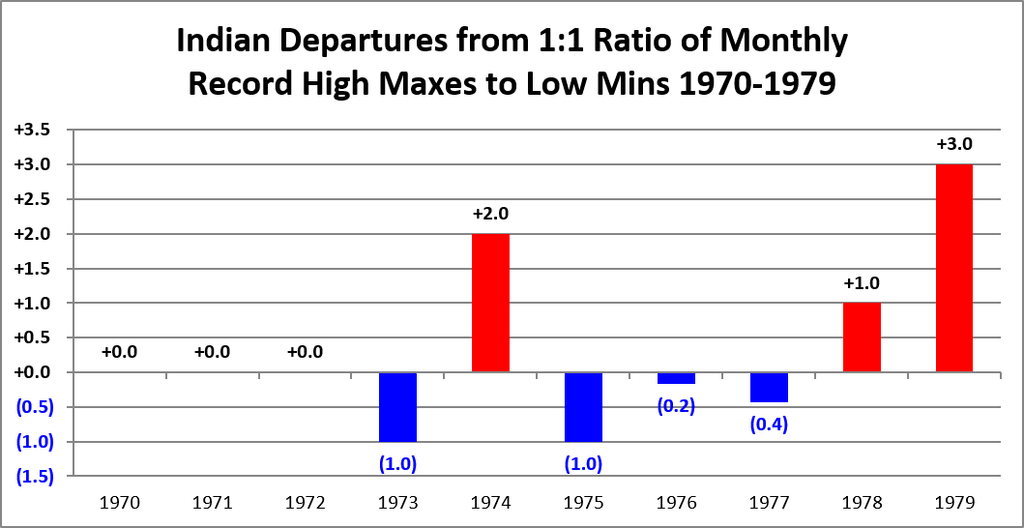

The 1960s:

All of the data listed below is part of this one chart:

The 2020s:
The 2010s:

The 2000s:

The 1990s:
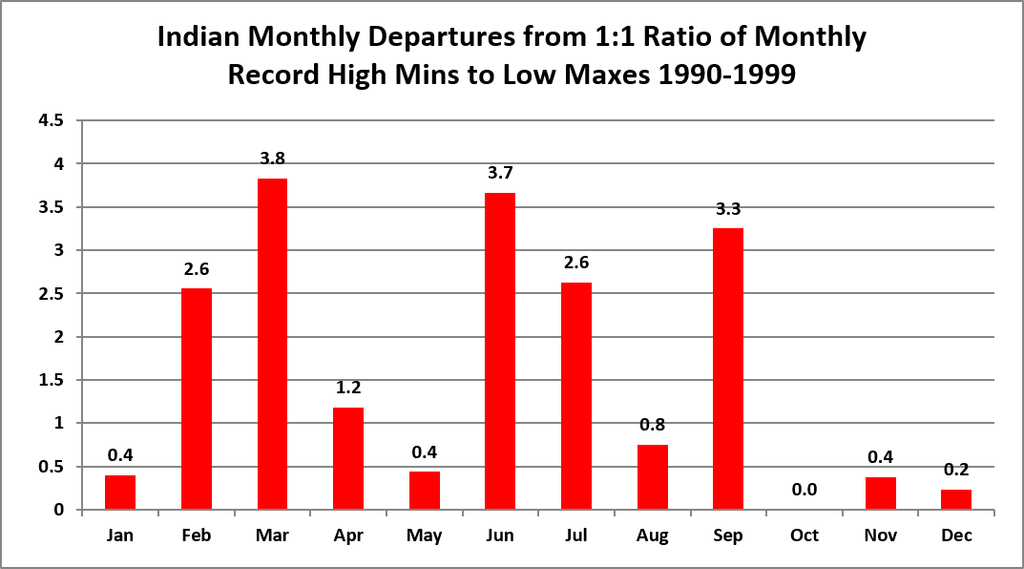
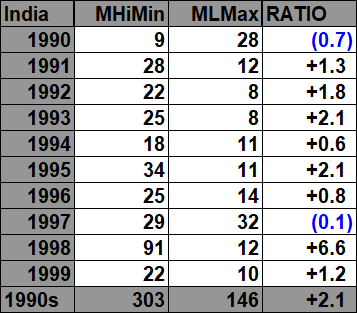

The 1980s:
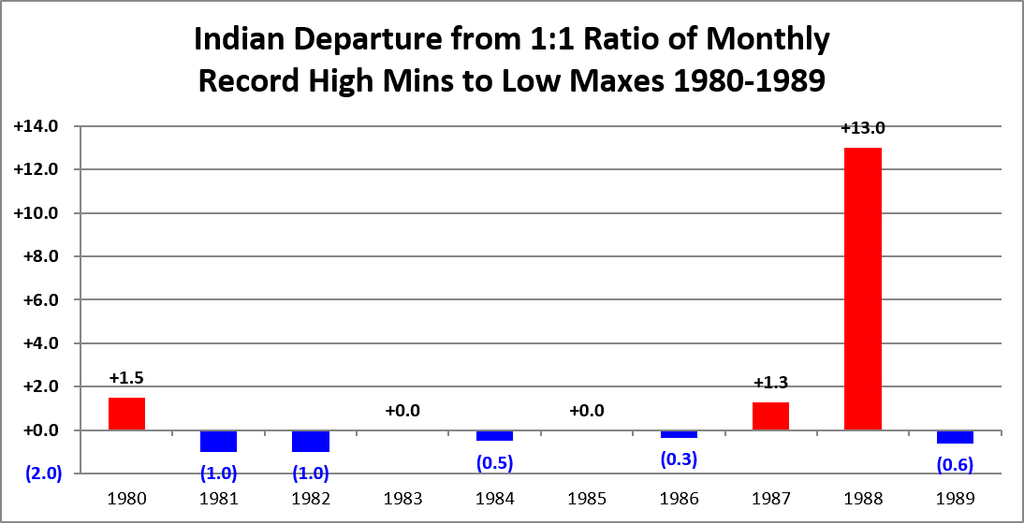
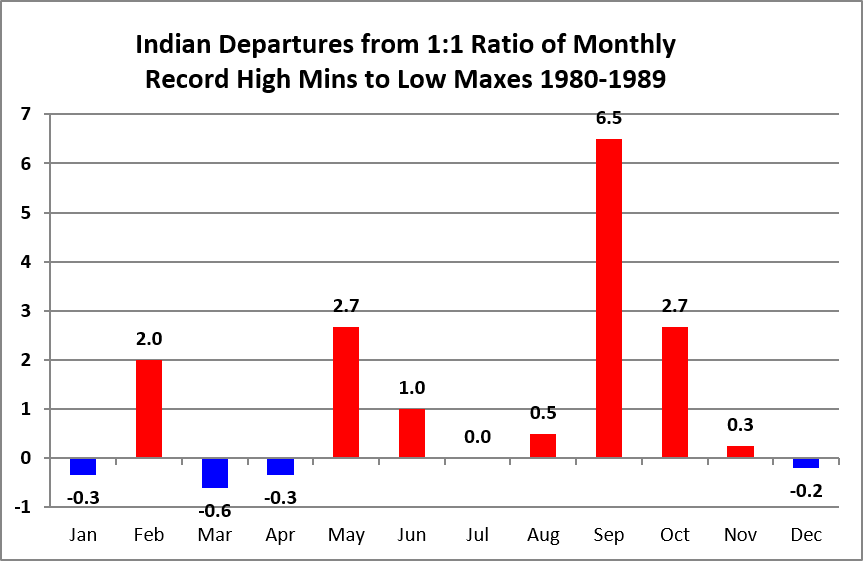

The 1970s:

The 1960s:

These are all available counts of NCEI monthly record temperature reports for India, including tied records, back to January 1973
The Climate Guy