The main purpose of this ongoing blog will be to track planetary extreme, or record temperatures related to climate change. Any reports I see of ETs will be listed below the main topic of the day. I’ll refer to extreme or record temperatures as ETs (not extraterrestrials).😜
How Super Typhoon Sinlaku Became a Warning Sign for a Potentially Historic El Niño
Dear Diary. Over the last few days there has been an extraordinary early and strong typhoon dubbed Super Typhoon Sunlaku that passed over portions of the northern Mariana Islands. The thing barely made any news here in the states, but some meteorologists did take notice:
Sinlaku is a portent for a potential record strong El Niño. For much more on this science here is an article from the San Francisco Chronicle:
How Super Typhoon Sinlaku became a warning sign for a historic El Niño
How the strongest storm on Earth became a warning sign for a potentially historic El Niño
By Greg Porter, Senior Newsroom Meteorologist
Updated April 14, 2026

People walk past a beach during sunset in Saipan in June 2024. The island, part of a U.S. territory known as the Commonwealth of the Northern Mariana Islands, may soon get a direct hit from the very powerful Super Typhoon Sinlaku. Yuichi Yamazaki/AFP via Getty Images
Update, April 15: Super Typhoon Sinlaku made landfall on the Northern Mariana Islands on Tuesday. Sinlaku’s eyewall moved directly over Saipan and Tinian late Tuesday night local time, striking as a strong Category 4 typhoon with sustained winds near 145 mph and gusts approaching 175 mph.
Super Typhoon Sinlaku, which will soon make landfall on American islands in the western Pacific with winds near 180 mph, is a catastrophic storm.
How did it become so strong so quickly? The short answer is that it is a product of an overheated ocean. The implications of this are even more interesting, or arguably alarming: Because it is so powerful, it is now helping push that heat across the Pacific toward what could be the strongest El Niño in a generation.
How the ocean built a monster
Sinlaku went from a tropical depression to a Category 5 super typhoon in roughly 72 hours, intensifying by 75 mph in a single 24-hour period. That kind of rapid intensification requires extraordinary oceanic fuel, and the western Pacific had plenty to spare.
In the waters southeast of Guam where Sinlaku intensified, sea surface temperatures are 30 to 32 degrees Celsius (86 to 90°F), warmer than average for April. That warmth is part of a much longer trend.
The western Pacific has been running abnormally warm for years. The World Meteorological Organization reported that 2024 was the warmest year on record for the Southwest Pacific. And in January 2026, waters around Tonga, Fiji and Niue were recorded at 5 to 7 degrees Fahrenheit above normal. To understand why that warm pool has grown so large, it helps to think about two forces working together.
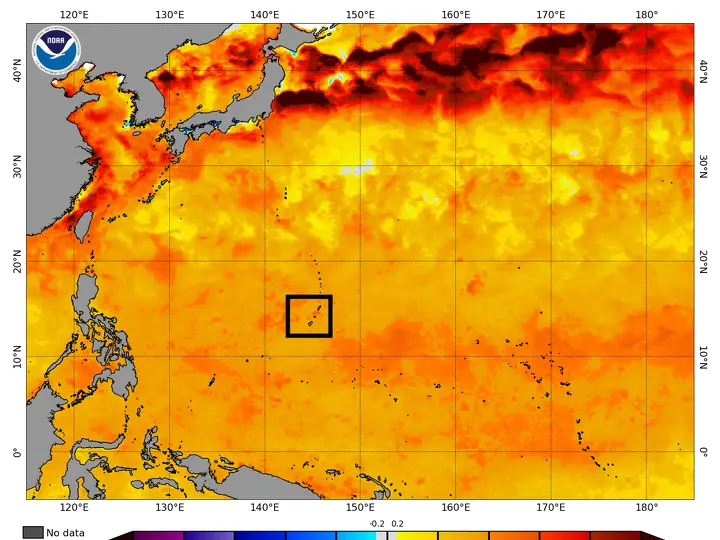
Year-to-date sea surface temperature anomalies across the western Pacific as of April 12. Deep orange and red shading shows water running well above normal across a vast stretch of ocean, including the waters where Sinlaku intensified southeast of Guam (black box).NOAA Coral Reef Watch
The first is the normal rhythm of the Pacific. La Niña, which has been the dominant pattern for most of the past six years, drives prevailing trade winds that push warm surface water westward, stacking it up near the equator west of the International Date Line. Below the surface, the warm water extends even deeper. Years of La Niña meant years of the ocean piling heat into the surface and subsurface western Pacific, building up enormous ocean heat content (a measure of thermal energy stored below the surface, not just at the top).
The second force is longer-term. The oceans globally have been warming for decades, and the pace has accelerated. Global ocean surface temperatures set consecutive records in 2023 and 2024. So while La Niña does its normal work of loading the western Pacific, it is stacking warmer water onto an already warmer baseline. The reservoir is deeper and hotter than it has been for any prior El Niño setup in the modern record.
Sinlaku didn’t just benefit from those conditions. It maxed them out. According to Jeff Masters at Yale Climate Connections, Sinlaku reached its maximum potential intensity, the theoretical ceiling for how strong a tropical cyclone can get given the ocean temperatures and atmospheric profiles around it. That is rare. Most storms fall well short of their maximum potential. Sinlaku used everything the ocean had to offer.
How the storm is now reshaping the Pacific
That enormous warm pool does not just fuel storms. It is also the raw material for El Niño. And Sinlaku is now helping move it.
When Sinlaku formed in the Northern Hemisphere, two other cyclones, Tropical Cyclone Maila and Tropical Cyclone Vaianu were spinning in the Southern Hemisphere just south of the equator.
Two storms rotating in opposite directions on either side of the equator act like a pair of hands pushing water in the same direction, eastward, along the equator, against the normal trade winds. Meteorologists call this a westerly wind burst, and it is one of the key mechanisms that triggers El Niño.
Think of the trade winds as a hand holding warm water against the western side of a pool. A westerly wind burst is what happens when that hand lets go and starts pushing the other way.
It does not travel at the surface. The warm water pushed by these bursts moves below it as what scientists call a Kelvin wave, a slow-moving pulse of heat that propagates eastward at depth before rising to the surface in the central and eastern Pacific.
A similar sequence played out in 1997. Tropical Cyclone Justin formed in March in the Southern Hemisphere, followed by Typhoon Isa in April in the Northern Hemisphere. Despite being separated by several weeks, the large-scale atmospheric circulation from those storms enhanced a westerly wind burst that helped launch the devastating 1997-98 super El Niño.
The parallels to 2026 are hard to ignore. Paul Roundy, an atmospheric scientist at the University at Albany, has said the westerly winds over the western Pacific right now are stronger than those during spring 1997. He has said there is real potential for the strongest El Niño in 140 years.
NOAA’s most recent update gives El Niño a 61% chance of emerging by early summer, with a 50% chance it becomes a strong or very strong event. Other major forecast models broadly agree, with the majority now calling for a strong El Niño by the end of the year.
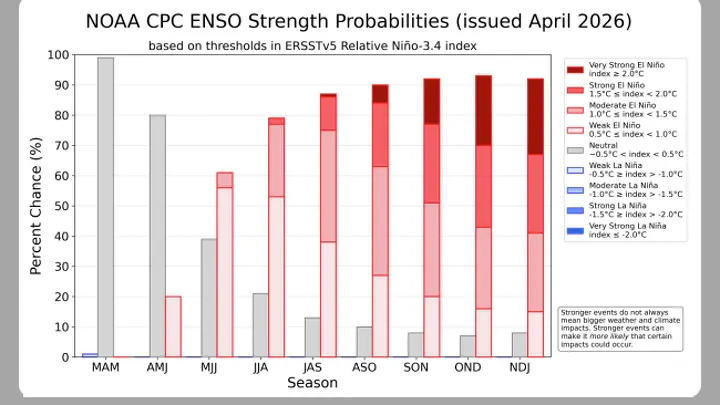
NOAA’s Climate Prediction Center probability forecast for El Niño. Red bars show the likelihood of El Niño conditions for each three-month period through early 2027, with odds rising significantly by autumn 2026. NOAA/CPC
Two out of the three very strong known El Niño winters steered more storms into California, with the 1997-98 very strong El Niño causing more than $1 billion in damage statewide.
Sinlaku’s historic strength is not just a headline. It is a warning sign that the Pacific is beginning its transformation toward a strong, potentially very strong El Niño, one that could reshape weather patterns both for California and around the world.

Senior Newsroom Meteorologist
Greg Porter is a senior newsroom meteorologist at the San Francisco Chronicle. Porter comes to Chronicle after seven years working as a meteorologist for the Capital Weather Gang at the Washington Post. Porter has also worked as a meteorological technical subject matter expert in for both government and commercial organizations around the world.
Porter received his Bachelors and Masters Degrees in Atmospheric Science from UMass Lowell and the University of Maryland. A native of Boston, Porter has also spent time living in Washington, D.C. and Edinburgh, Scotland.
Outside of work, Porter loves to spend time with his wife and very energetic 2 year old son. He also enjoys spending as much time outside as possible and he fancies himself a very average golfer.
Here are some “ETs” recorded from around the U.S. the last couple of days, their consequences, and some extreme temperature outlooks, as well as any extreme precipitation reports:
Here is More Climate News from Wednesday:
(As usual, this will be a fluid post in which more information gets added during the day as it crosses my radar, crediting all who have put it on-line. Items will be archived on this site for posterity. In most instances click on the pictures of each tweet to see each article. The most noteworthy items will be listed first.)