I ended my “Heat and Flood Diary” posts a couple of weeks ago when the last dangerous heat of the 2017 season subsided and Irma died over the South. On September 1st at the height of the last heat wave San Francisco established an all-time high of 106F. Now there has been an astonishing flip/flop in the weather pattern leading to record heat in the East and early fall snow in mountainous areas, and below average temperatures in the West. Although not as dangerous as mid-summer heat there have been numerous records set from the Midwest into the Northeast the last few days. It’s time for fall folks. This weather pattern is anything but. Yes there have been a substantial number of record lows set when the polar jet has dug into the East earlier this month and now in the West, but as expected with climate change, the heat is trumping any cold, and as I’ll point out this pattern will only get weirder and spookier as we move into the Halloween month of October.
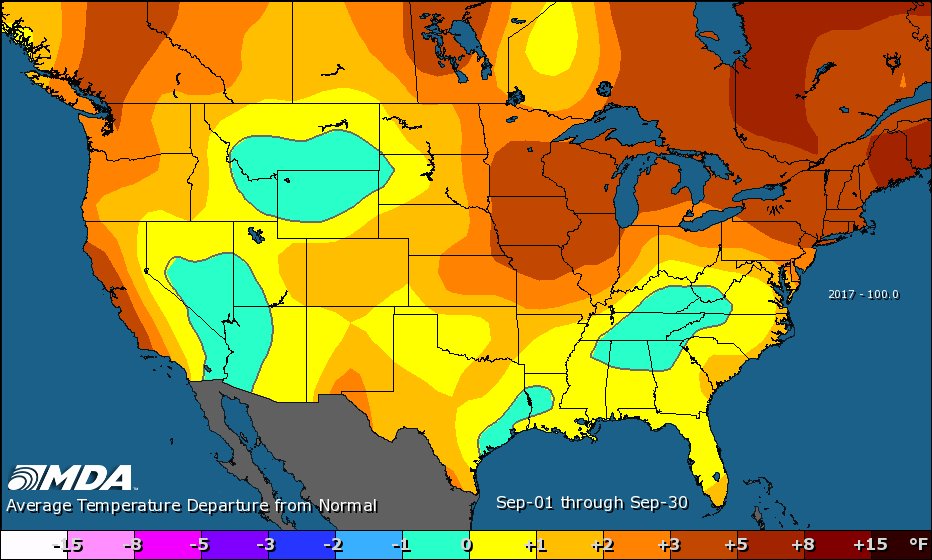
First, as pointed out by MDA Weather Services, here is that big flip/flop from early to late September (including forecast temps through the end of the month):

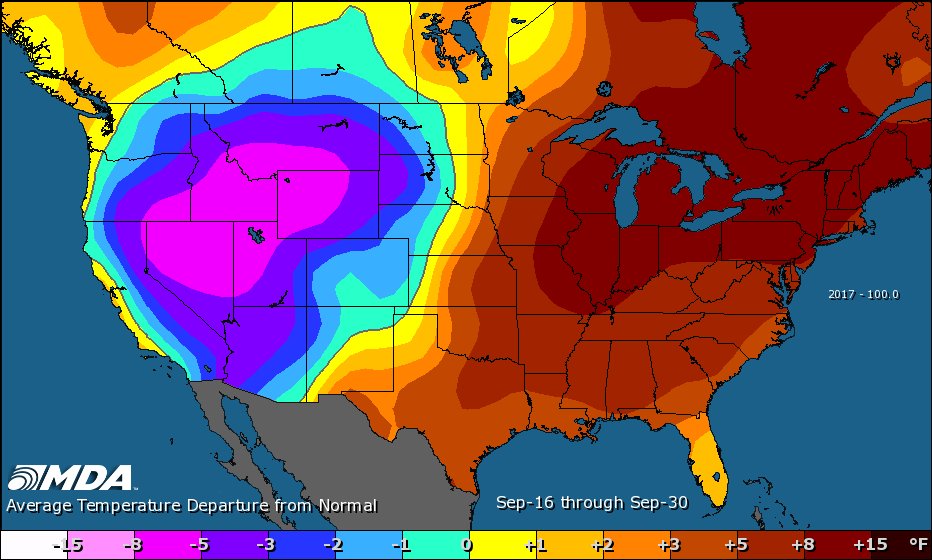
If you look carefully at the two charts note that the above average areas exceed the magnitude of below average areas; thus, we are seeing more record highs getting established than lows In September. The net result looks like this:
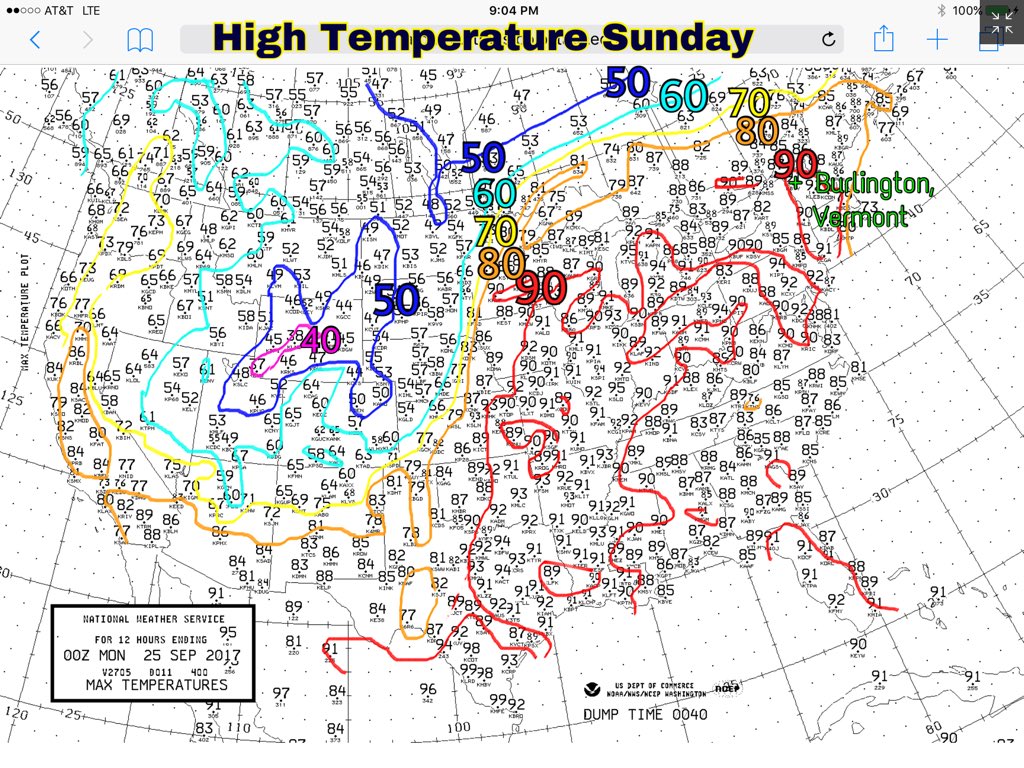
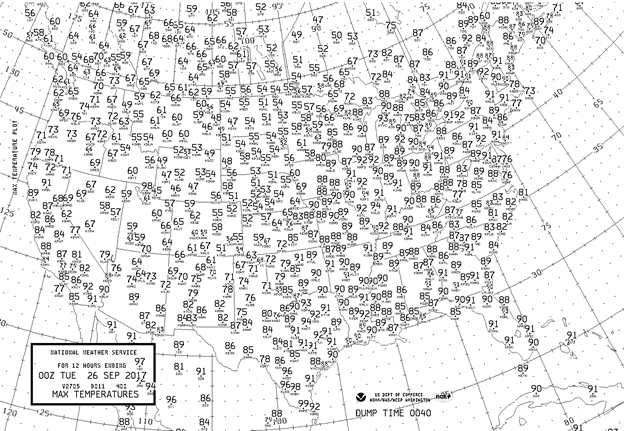
Here is Sunday’s max chart as isoplethed by Heatwave Berler noting a remarkable temperature pattern across the United States:
I’m seeing some very “weird” jet stream patterns around the northern hemisphere this month. Here we see the current pattern of a huge, warm anomaly over Scandinavia and above average 500 Mb heights in eastern North America looking at Penn State ensembles:
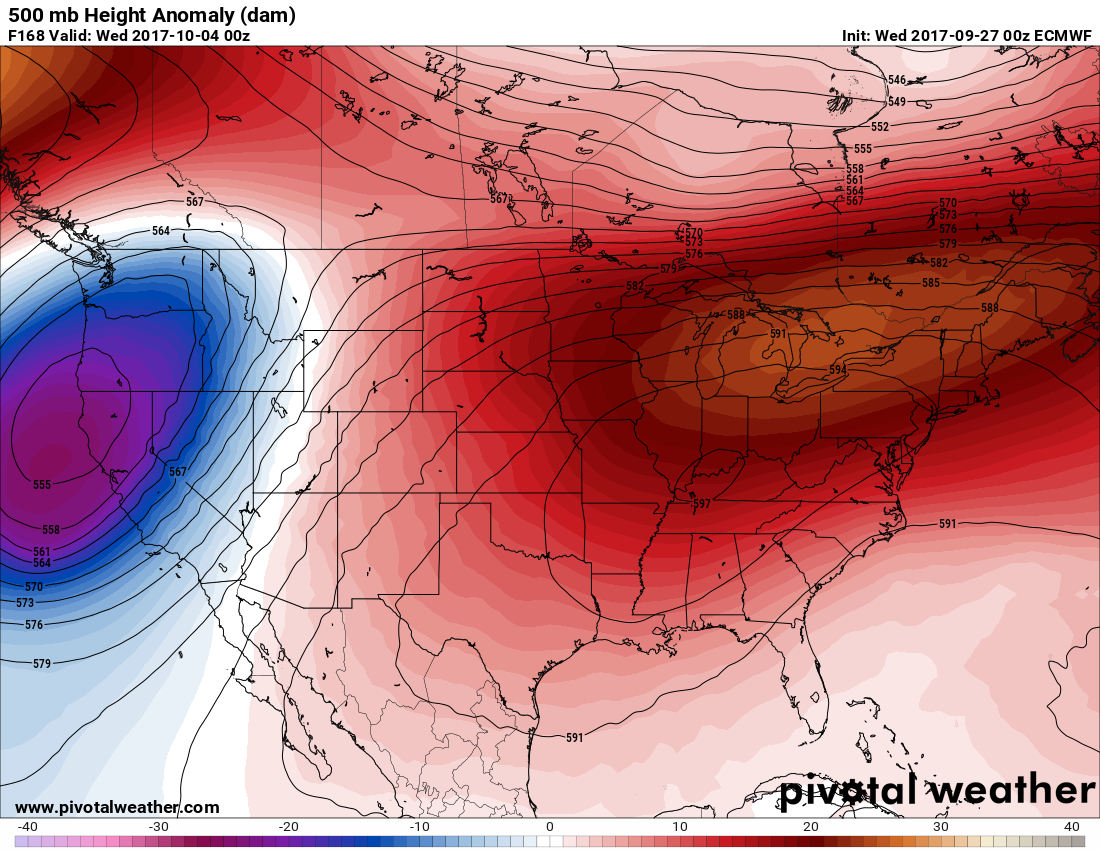
One of the few cold pockets is milling around south of Greenland. As we move into October more large, warm anomalies, or heat domes are forecast in generally the same areas:
The fairly reliable European Model forecasts a whopper of a heat dome spanning 3/4 of the nation by October 5th:
 The bottom line here, look for more odd, record warmth in the eastern U.S. as we move into October. Frost on any pumpkins will be delayed for much of the East. Will the warmth in October scare (pun intended) more people into believing that man induced climate change is occurring? Depending upon how warm we will see.
For an in depth look at the record heat of the past week see this fine Washington Post article by Jason Samenow:
Six days in a row in Chicago at or above 90F in late September? Unheard of. Chicago (O’Hare) had a record high today of 92F (September 25th) beating the old record of 90F set in 1933, which was that 6th consecutive day. Here are the rest of today’s toasty maxes east of the Rockies:
Quoting Jason Samenow: “The increasing prevalence of such warm weather extremes is exactly what we expect as concentrations of heat-trapping greenhouse gases rise in the atmosphere.”
Just wow! The 00Z WED European model was forecasting a 597+ decameter ridge over the Ohio Valley on October 3rd. Heights of this magnitude across the CONUS are rare by mid-summer standards, and would be unprecedented for October:
Unfortunately this warm synoptic Patten is conducive for tropical development in the Gulf. Don’t look now, but in 240 hours the fairly reliable European model has this:
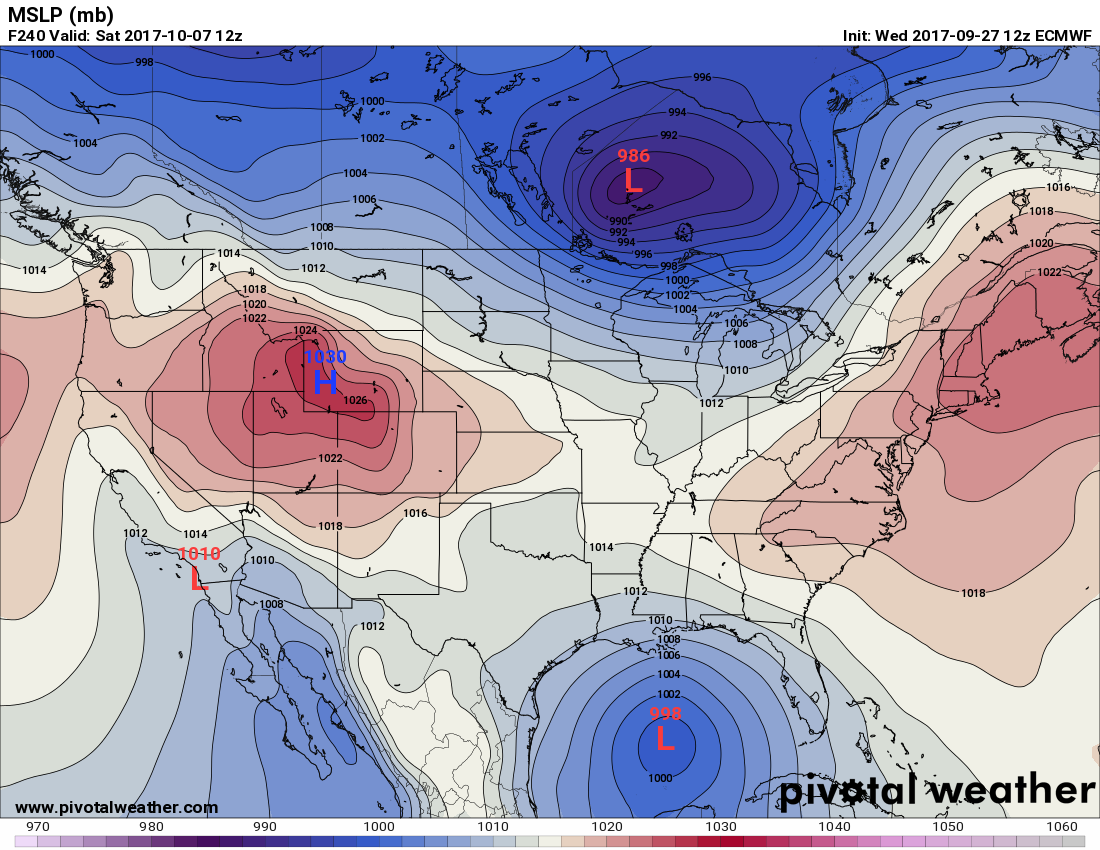
The above chart is going to “spook” a lot of people.
I have no doubt that September 2017 will be the 34th consecutive month of more daily record highs than lows in the NCEI database… a record in of itself that keeps going on and on. (I’ll replace this chart with updated versions as new data counts come in, which has accumulated data through 9/25):

I’ll be adding more to this post as relevant items cross my radar.
The Climate Guy