By now there are numerous articles and posts concerning the ongoing California wildfire disaster, which is the worst in that state’s history. The links to climate change are obvious, but I can add some simple statistics helping to cement claims of attribution. Let’s look at the three steps that led to this tragedy.
First there needed to be ample rainfall to grow vegetation, which is the fuel for the fires, such as scrub grass. Coming on the heels and ending the five year drought we had that in spades over the last winter and spring. The following chart, which I compiled using NCEI data, depicts the number of daily precipitation records that were either set or tied per month, and the California state precipitation ranking since 1895. 1 would be the wettest and 123 would be the driest through 2017:
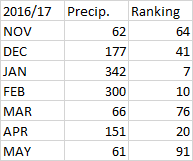
The period from DEC-FEB (winter) ranked 2nd overall. There were over a thousand precip amount records either set or tied across California from NOV 2016-MAY 2017. Remember the soggy saga of the Oroville Dam? Climatologists were marveling at how wet the winter was attributing heavy precipitation to the phenomenon of a warmer atmosphere squeezing out more liquid than in a lower CO2 regime.
This chart from Rob Elvington shows that fuels were at above average levels for the disaster and continue to be at near record high levels as of 10/11 (blue line) :

Second we need a period for those new growth fuels to mature then dry out. Summer 2017 across California certainly fit that bill. My second chart depicts my specialty, those tabulations of daily record maxes and minimums per month, but in California alone, and that state’s average temperature ranking per month with 1 being the warmest and 123 being the coolest since 1895:
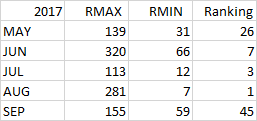
August 2017 turned out to be the hottest month in California’s history. Summer 2017 also ranked numero uno. By my count the ratio of DRHMX to DRLMN was a whopping 8.4 to 1 from JUN-AUG looking at all California stations. I was surprised to see California getting this hot after such a wet winter and spring. Obviously record heat is a climate change phenomenon. On September 1st San Francisco saw an all-time record maximum of 106, for example. Just how warm was California this summer looking at climatology? Astonishingly so looking at this chart from Eric Holthaeus: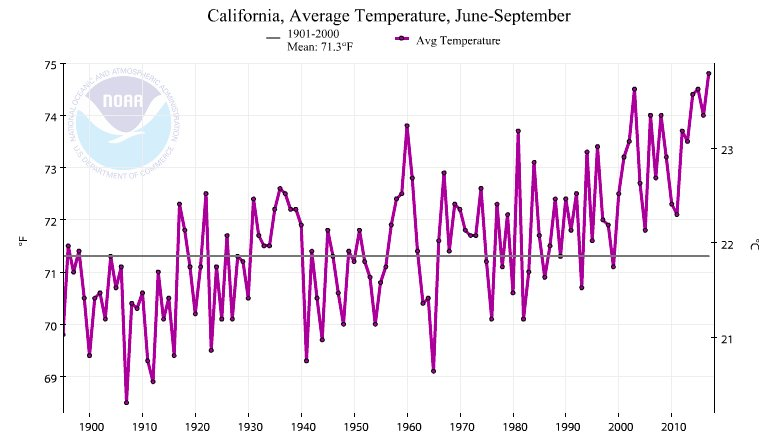
California appears to be the canary in the coal mine for climate change in the United States, where we have seen wild fluctuations in precipitation due to warming temperatures affecting rain and snowfall patterns the last few years.
Wildfires were already being sparked and growing during California’s record hot summer. The last and third ingredient for this recipe for disaster was a typical October regime producing those Diablo or Devil winds fanning the flames. These occur in northern California when the jet begins to dig in the Pacific Northwest tightening the pressure gradient. The jet only dug as far south as Oregon so fire quenching rain and higher humidity did not a company the drying north or northeast winds. Here we see on these Pivotal Weather charts a Diablo wind set up that occurred on Wednesday. First the jet at 500 mb:
 Then the winds at the surface across northern California:

Note the northerly component to the winds across the Sacramento Valley.
The disaster that occurred at Santa Rosa and many other locations was months in the making, synoptically, and years and decades if we take into account climate change. California has always had a wildfire problem, but this year’s record precipitation and temperatures made a bad situation horrific. Thankfully the state government of California headed by Jerry Brown is taking responsibility doing what they can to help with mitigation and adaption efforts.
For another thorough post on this subject read the Wunderground post here:
https://www.wunderground.com/cat6/deadliest-fires-california-history-arent-over-yet
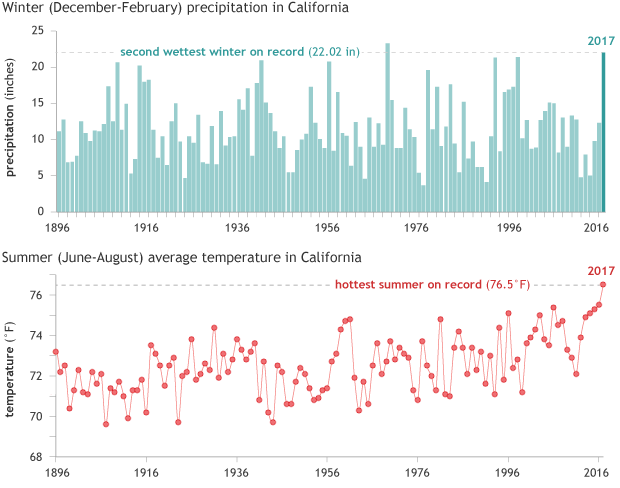
Here is another chart from the Wunderground blog showing how wet then hot California has been in the past year:
What I’m going to do with this post is leave it open. As more attribution data to the California fires crosses my radar I’ll add it here.
The Climate Guy