Friday February 9th… Dear Diary. The main purpose of this ongoing post will be to track United States extreme or record temperatures related to climate change. Any reports I see of ETs will be listed below the main topic of the day. I’ll refer to extreme temperatures as ETs (not extraterrestrials)😊. Here is today’s climate change related topic:
Unusual January Climatology
Usually when I pair up monthly record count statistics with National Center for Environmental Information lower 48 state temperature average rankings there is a fairly good match. A cold month will have more cold records while a hot month more warm records, so I was a little surprised to find out that January 2018 was ranked at 90th coldest or 35th warmest since 1895 (or when rankings started). Looking at the “record scoreboard” updated as of today you can see how well rankings match up with record count back to January 2014:
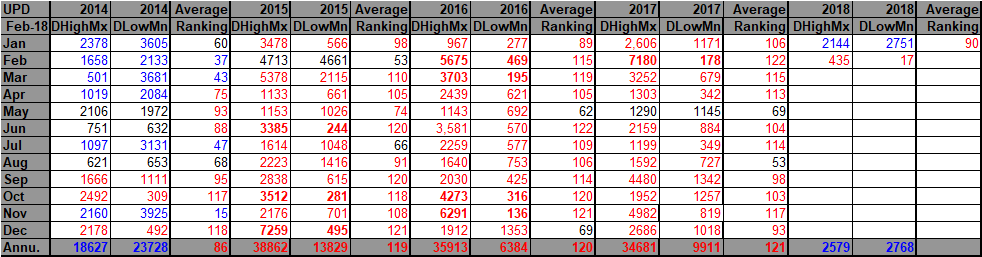
It’s time for me to explain again what is depicted in the record score board. Each daily record including ties that is recorded in the NCEI database gets counted as one tally. For example, there have been 435 tallies of record highs, so far for February 2018. Those months and years in which there are significantly more record highs than lows are colored red, and vice a versa blue. Months are arbitrarily colored black when the ratio of DHMX to DLMN is very close to 1 to 1. The same color scheme is used for average temperature rankings. Those rankings that are between 52 and 72 or + or – 10 from the average ranking of 62 (as of 2018) are colored black. If the ratio of DHMX to DLMN exceeds + or – 10 that month or year’s data is catalogued in bold text.
The last time record counts and lower 48 temperature rankings were out of sync was in April 2014. To be frank I wish that NCEI had a system that could exclude Hawaiian and Alaskan record data easily so I could get a better match of the data on the scoreboard. Also there needs to be a good method for selecting stations with relatively long periods in which records have been taken (or PORs) for dataset improvements. If there are changes I’ll let all know, of course.
The explanation for the disparity in the data for January 2018 can be summed up in one word…the dipole. A constant ridge of warm high pressure remained over the West with a cold trough in the East. There are more stations in the eastern U.S. than West, which can set records; thus, leading to higher record cold counts in January. The first five days of the month were the coldest in the East. After that some warmth ahead of fronts surged out of the West. From Bob Henson’s post: https://www.wunderground.com/cat6/us-ran-hot-and-cold-mostly-dry-january
“According to preliminary data on NOAA’s Daily Weather Records website, the interval from Jan. 5 to Jan. 31 saw a total of 1783 daily record highs broken or tied, almost three times the 611 daily record lows broken or tied.”
Many states in the West had a top 5 warm ranking while those in the East didn’t even crack a top 10 cold ranking:

The bottom line here is that what happened with the dipole in January 2018 is systemic of climate change, but the dipole did produce record cold in the East. We saw this happen occasional back in the two “cool” years for this decade, 2013 and 2014 before the advent of a super strong El Nino.
……………………..
I’ll add record data for the 9th as it crosses my radar. Here is what I have, so far:
RECORD EVENT REPORT
NATIONAL WEATHER SERVICE SAN FRANCISCO BAY AREA
410 PM PST FRI FEB 9 2018
…RECORD HIGH TEMPERATURES FOR FRIDAY FEBRUARY 9, 2018…
LOCATION MAX TEMP PREVIOUS RECORD
————————————————————
SANTA ROSA 78 75 IN 2006
KENTFIELD 75 74 IN 1945
SAN RAFAEL 79 70. IN 2016
NAPA 76 75 IN 2006
SAN FRANCISCO 76 73 IN 2006
SAN FRANCISCO AIRPORT 74 71 IN 2016
OAKLAND AIRPORT 72 70 IN 2016
LIVERMORE 80 77 IN 1917
MOFFETT FIELD 77 74 IN 2006
SAN JOSE 80 76 IN 2016
SALINAS AIRPORT 81 TIED 81 IN 2016
The Climate Guy