Wednesday February 28th… Dear Diary. The main purpose of this ongoing post will be to track United States extreme or record temperatures related to climate change. Any reports I see of ETs will be listed below the main topic of the day. I’ll refer to extreme temperatures as ETs (not extraterrestrials)😊. Here is today’s main climate change related topic: Some February 2018 Climatology
(If you like these posts and my work please contribute via the PayPal widget, which has recently been added to this site. Since I am a paraplegic I can definitely use any funds for medical expenses. Thanks in advance for any support.)
It’s the end of yet another month, so we can begin to piece together temperature averages and compare February 2018 to prior months. Also it’s the meteorological end of the winter of 2017/18. In the United States data is in the NCEI record site through 2/26, so we have a pretty good idea how ratios of record warm to cold records will stack up once data is processed through months end. Here is my “record scoreboard” through 2/26/18:
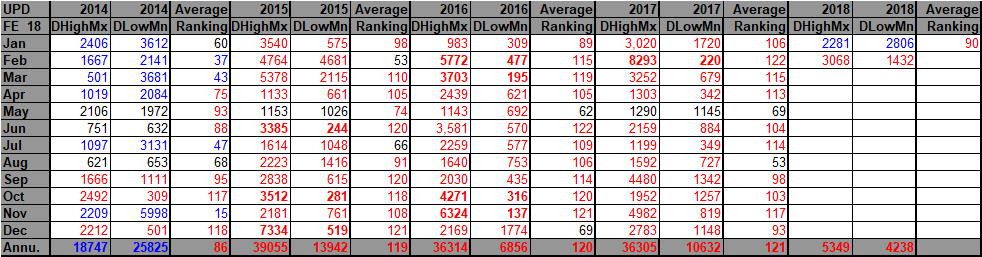
Yes, we see the persistent pattern of more daily record highs than lows returning for February 2018. Here is some more record count data for comparison:
3068 DHMX 1432 DLMN 3411 DHMN 1557 DLMX 264 MHMX 3 MLMN 446 MHMN 3 MLMX
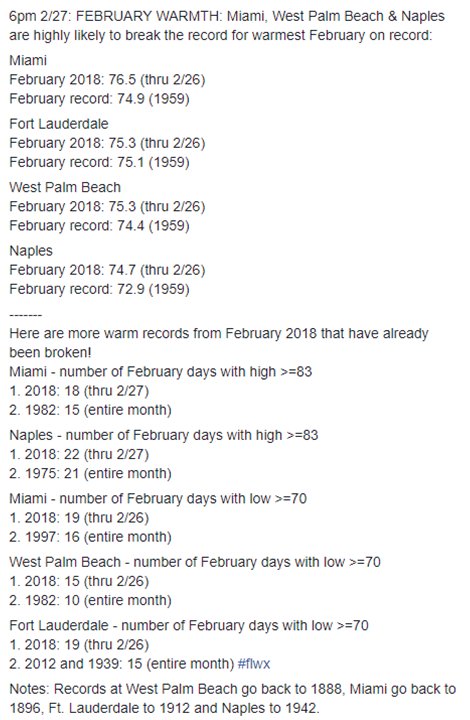
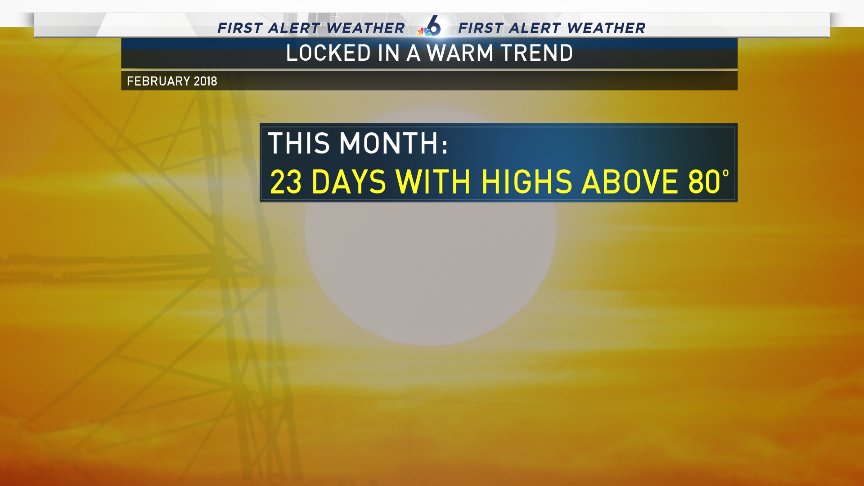
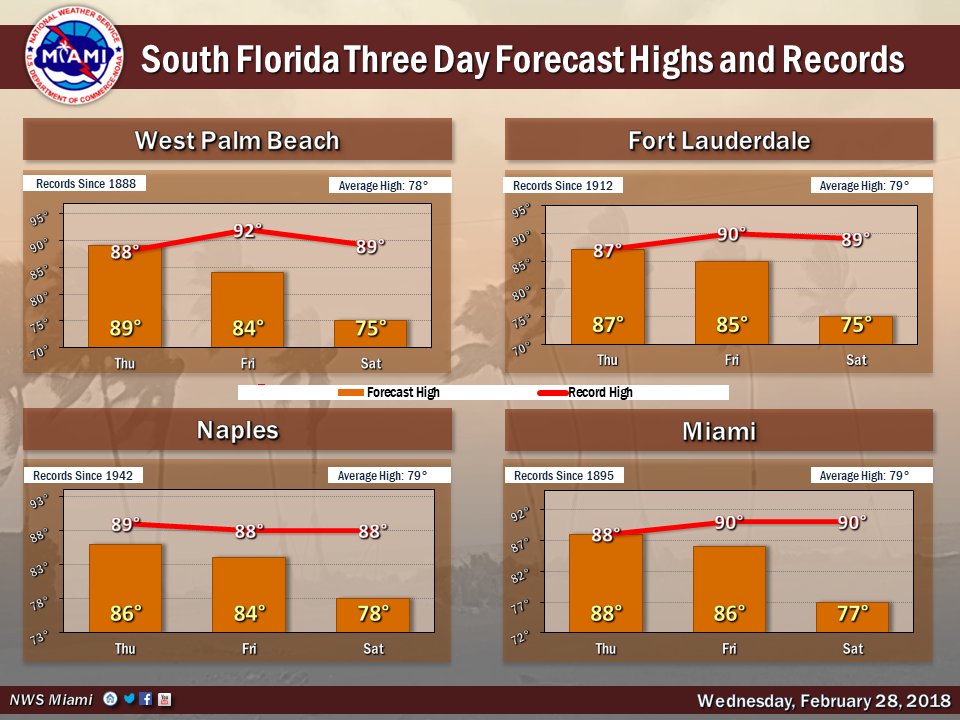
Most of the record warmth was in association with a “mega ridge” in the East late in the month while most of the record cold counts came from the West, which was under the influence of a cold trough also late in the month. What stands out is that a count of 710 monthly warm records were either tied or set while only 6 monthly cold records were recorded. The monthly record counts indicate that the western chill was far less intense than the eastern heat. There were no all-time cold records set. Usually in February a few all-time cold records are recorded somewhere in the U.S. These stats indicate to me that average wise February 2018 should see at least a top 30 ranking since the year 1895 when rankings began. Here are some more indications that some states had a very warm February:
 NWS MiamiVerified account @NWSMiami

NWS MiamiVerified account @NWSMiami
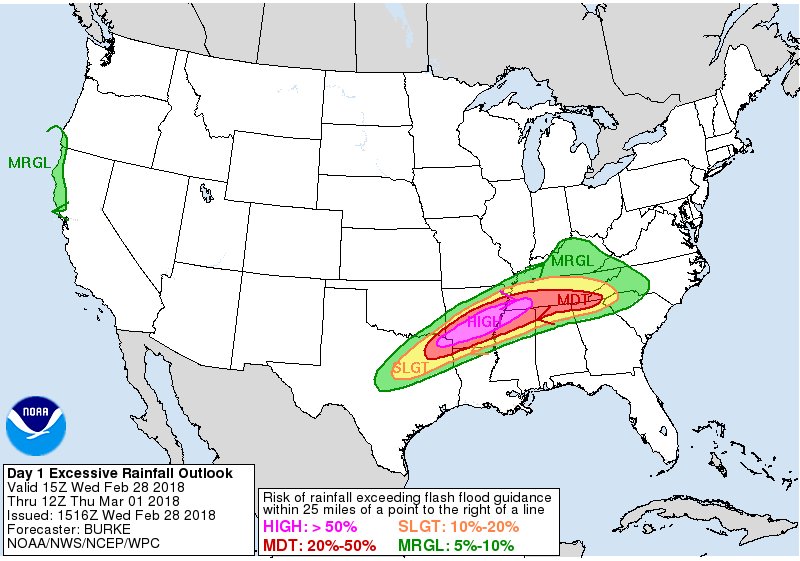
It certainly has been wet from the southern Plains through Arkansas into the Ohio Valley, and going into March we see another flooding setup:

I saw a great graphic today indicating how warm the planet is at the end of February plus where the few cold pockets reside:
 Robert Fanney @robertscribbler
1. Arctic much warmer than normal at +4.4 C.
2. Polar vortex collapse drives cold air S into Europe.
3. Globe warmer than normal at +0.7 C.
4. All major climate zones except Antarctica warmer than 30 year average.
5. Note Africa – S. Asia.
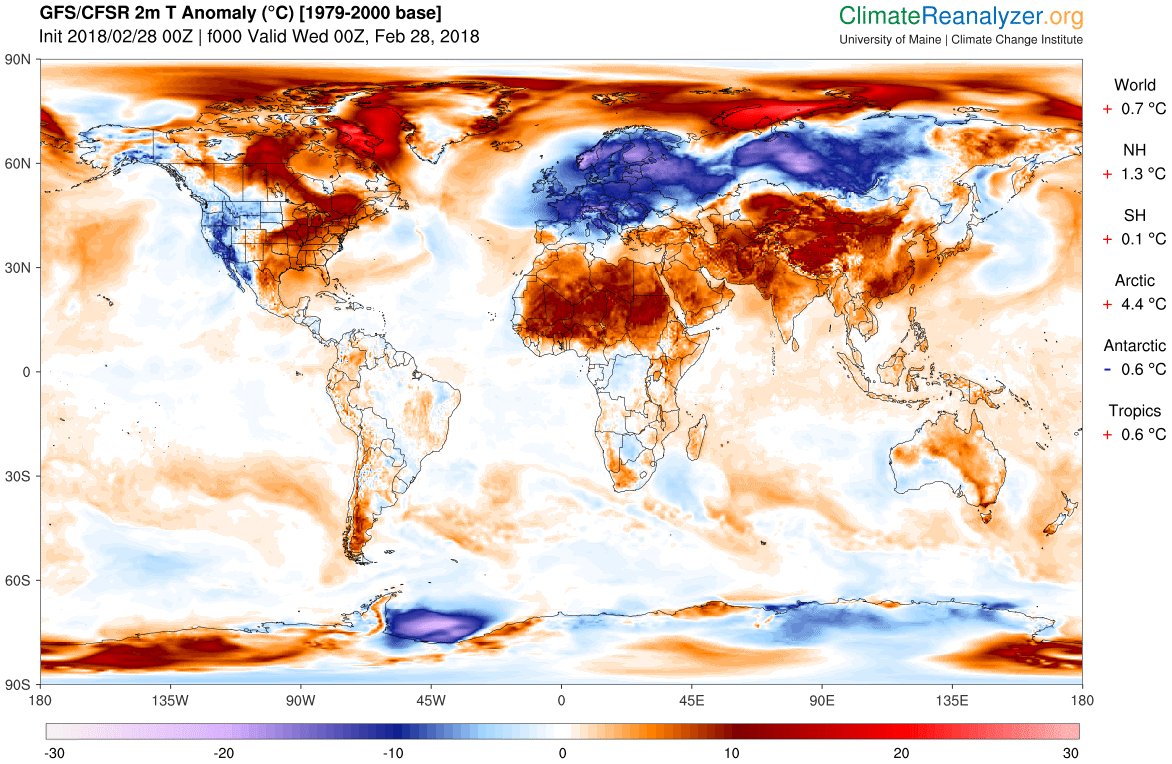
In contrast with most of the winter the American West is also one of the few areas on Earth with below average temperatures.
All of these statistics presented today point to a warming world due to carbon pollution. I’m not seeing any signs of a slow down in the warming trend, unfortunately.
I’ll be adding more relevant data should I see any later this evening.
The Climate Guy