Saturday March 31st… Dear Diary. The main purpose of this ongoing post will be to track United States extreme or record temperatures related to climate change. Any reports I see of ETs will be listed below the main topic of the day. I’ll refer to extreme or record temperatures as ETs (not extraterrestrials)😊. Here is today’s main climate change related topic:
March 2018 Record Trends
It’s the end of another month with March 2018 going out like a lamb except across a few areas in the northern U.S. where snow is falling. At the end of every month I present my “Record Scoreboard,” which keeps tabs on the number of extreme temperatures, or surface record tallies, reported into the National Center for Environmental Information’s database. This is what we see with data updated through 3/27/18:
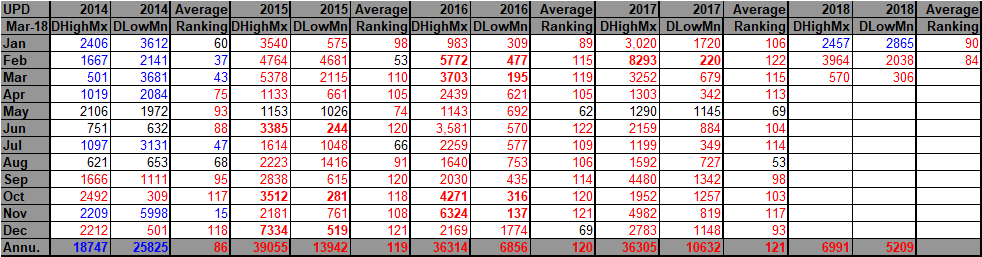
Here we see that there have been more daily record highs than lows for March 2018, which has become the prevalent pattern after 2014, but there has been a relative derth of record reports both on the hot and cold end of the spectrum. The last similar month I see on the chart was January 2016 when there were about 1300 reports. So far for March 2018 we have only 876 reports. In any case we see the usual numerical pattern taking unto account record daily high minimums and daily low maximums, except that daily low maxes exceeded daily high maxes by a few points, so far during March 2018:
797 DHMN 593 DLMX 570 DHMX 306 DLMN
Nights are warming faster than days.
I suspect that when NCEI processes temperature data March 2018 will be close to average with warmth coming from portions the West and chill in the East.
Usually after three months based on trends I have a decent idea of how the ratio of DHMX to DLMN records are stacking up for a new year. Here is what we have so far compared with the rest of the years of this decade:
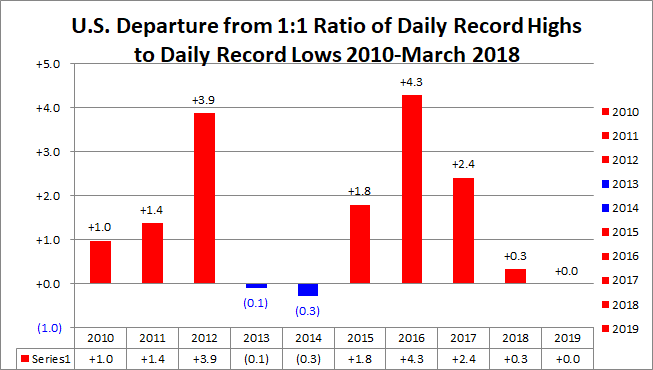
We are coming off a “spike” warm El Nino year in 2016 with the cold polar vortex a bit stronger, so we have, so far, a ratio of about 10 to 7 of record DHMX to DLMN, a statistic that is “cooler” than the last three years. Here is something interesting. Let’s take our “way back” machine to look at record ratios coming off a similar “super” El Nino in 1998:

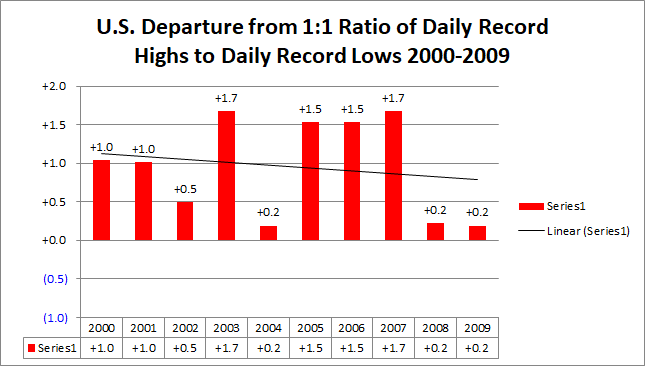
From 1998-2000 we see a cooling trend, which levels off during the last decade. 2018 may very well end up being the nadir after about three years of cooling coming off a near record El Nino…a trend for forecasting purposes the next time a strong El Nino happens. Global warming is a two steps forward and one step back phenomenon, at least since 1980, with contrarians harping on one step back occurrences. We will see how record stats unfold moving through the spring.
……………………………………………………………
Here is an “ET” for 3/31 from Alaska:
 Rick Thoman @AlaskaWx

How about a little fun? I found these “climojis” on social media for all to enjoy. Pick your favorite.😉

(If you like these posts and my work please contribute via the PayPal widget, which has recently been added to this site. Thanks in advance for any support.)
The Climate Guy