Friday June 1st… Dear Diary. The main purpose of this ongoing post will be to track United States extreme or record temperatures related to climate change. Any reports I see of ETs will be listed below the main topic of the day. I’ll refer to extreme or record temperatures as ETs (not extraterrestrials)😊. Here is today’s main climate change related hot topic:
Summer 2018 Forecast
It’s time for me to make an attempt at another seasonal forecast for temperatures for the lower 48 states. Summer to me is the most important season for temperature forecasting because its heat can turn deadly, particularly in this day and age of global warming. Any one month or even week from June through August forecast to have above average temperatures for the country as a whole likely will see a region across the country that can be categorized as a deadly heat wave. It’s important to give local authorities as much lead time as possible to make preparations for deadly heat that also, more often than not, is accompanied by drought for agricultural interests. Granted though, the state of long range forecasting for regional areas is not great, so only general forecasts can be made.
Well, here is my two cents for a broad, rough forecast for the U.S. First, I like to look at water temperature anomalies surrounding North America just before the start of a season to get a sense of how much potential added heat can be added to the atmosphere across the continent. Here is what we see:

I’ve seen warmer sea surface temperatures surrounding North America in late May. Here we see both warm and cold anomalies in the Pacific, Gulf and Atlantic Seaboard area leading me to believe that this is a neutral factor.
Second I like to look at the strength of the Hudson Bay low or what’s left of the polar vortex at the start of summer. Here we see a relatively weak cold pocket low displaced well north of Hudson Bay. Last summer we saw a strong vortex ushering cool air masses into most of the CONUS except in the broiling Southwest. This time around, at least initially, the low is weak, which should allow for upper ridges or heat domes to build across the CONUS more than they did last summer:

As discussed yesterday a strong ridge should build over the southwestern drought area encompassing much of the Plains, perhaps extending into the East. Such a pattern would produce a very toasty June through at least 6/15 and probably beyond. Today’s European model holds to this forecast:

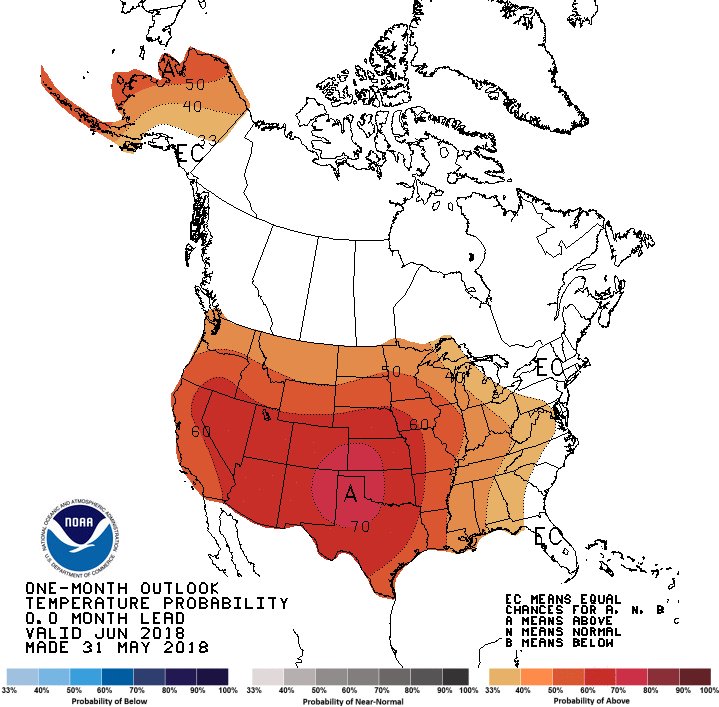
It appears that June, as has been the case for all Junes this decade, will be a scorcher across a good chunk of the country:
Well…..looks likely we’ll see a scorcher of a June ahead. 


#okwx


Notice that nearly every month saw an above average ranking (from the median number of 62) since the start of 2014. The big monkey wrench in the warm works was April 2018, which turned out to be exceptionally cold from Montana into the Midwest. Before the next strong El Nino occurs I suspect that the U.S. will have a few more cold months like April. Will July or August be relatively cool? It is doubtful, but possible. Seasonal forecasters are beginning to “chuck it” giving up on forecasting cool seasons simply because of what carbon pollution is doing to the planet. Certainly 2014 saw more than its fair share of cool months, though.
I suspect that 2018 will see more than just two relatively cool months, as has been the case, so far. Keeping this in mind, though, and since June will start out hot expanding the drought in the Plains, I’m forecasting that all three summer months will have above average temperatures across the CONUS.
Let’s see what the NWS forecasts:

Due to the initial weakness of the Hudson Bay low the Midwest may be warmer than the NWS forecast. Other than that I can’t disagree with this NWS graphic. Look for hot, uncomfortable times from Texas and the southern Plains west into the Desert Southwest with occasional bouts of record heat extending east and north into the Great Lakes and Middle Atlantic.
Other similar forecast can be read from the Washington Post here:
You can read my prior forecast for spring 2018 here:
https://guyonclimate.com/2018/03/02/extreme-temperature-diary-march-2-2018-spring-2018-forecast/
Here is my updated chart for rankings of seasons and months since the start of this decade:

I’ll fill in the ranking for this spring when NCEI processes that number by June 8th here: *103*
Notice that the past three summers had a ranking at or above 109 ranking, but those of 2013 and 2014 were close to average. I think that this summer will be ranked somewhere in between the last six. We remain way overdue to see an average or below average season across the U.S. Carbon pollution is definitely making below average seasons more rare. I’m going to guess that summer 2018 ranking will fall around 105 + or – 10, with fairly good confidence. This summer will probably be about as hot as last year. Given all of the warm factors shown in this post, it should be hotter than average with some dangerous heat for many sections of the country. I think that June will see the highest monthly average ranking with a “cooling trend” thereafter in July and August, which is going out on a limb a little more. Let’s see if this forecast will be a bust or like the last few fairly decent.😅
(If you like these posts and my work please contribute via the PayPal widget, which has recently been added to this site. Thanks in advance for any support.)
The Climate Guy
