Tuesday June 19th… Dear Diary. The main purpose of this ongoing post will be to track United States extreme or record temperatures related to climate change. Any reports I see of ETs will be listed below the main topic of the day. I’ll refer to extreme or record temperatures as ETs (not extraterrestrials)😊. Here is today’s main climate change post related hot topic:
Climate Sensitivity Discussion
We are coming up on the 30th Anniversary of Dr. James Hansen’s testimony before Congress on 6/23/1988 in which he laid out anthropogenic global warming theory that brought the future of climate to the forefront of public discussion. This is also the 30th anniversary when I became convinced that AGW was occurring because of Hansen’s testimony. Many articles have already been written on this anniversary, which I will present later this week and also on the 23rd. AGW is not a theory any more…It’s now fact, so any debate is quickly shifting to what is called “climate sensitivity.” Before taking a look at the deep meaning of Hansen’s 30th anniversary, today let’s give this site’s floor to another climate scientist, Zeke Hausfather on the subject of climate sensitivity.
Climate sensitivity is defined by how much climate is affected by a doubling of preexisting carbon levels in the atmosohere. We all know that the more CO2 in the atmosphere the warmer the average temperature of Earth will be affecting everything from sea level rise to ocean circulations, and yes specific climates of every small region on the planet. What we don’t know exactly is specifically what range of average global temperatures we will see when CO2 levels off to a certain level, hopefully after the hard work of mitigation takes effect. For example, I cannot state that global temperatures will level off at +3.0C above preindustrial levels at 450 parts per million of CO2 in the atmosphere. Climate scientists are debating ranges, which is what I am most concerned with, my “how fast how bad” question, which I’ve made reference to a lot. Anyway, without further ado, here is most of Zeke’s thread along with his climate sensitivity charts, which I saw in Twitter this morning:

Quoting Zeke Hasfather:
CO2 has increased from its pre-industrial level of 280 parts per million (ppm) to around 408 ppm today. Without actions to reduce emissions concentrations are likely to reach 560 ppm – double pre-industrial levels – around the year 2060.
In general there is little evidence that the range of sensitivity has narrowed over time, or that it has gotten higher or lower than our estimates from 20 years ago. 2/5
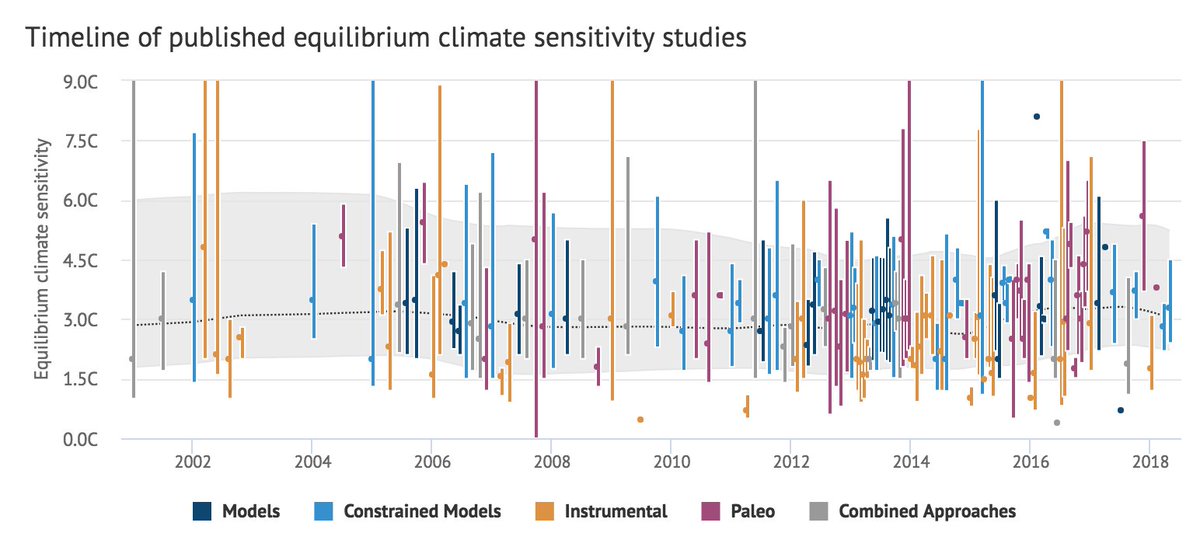
Plenty of individual studies show a narrower range, though they are not particularly consistant with eachother. Similarly, some approaches tend to show different sensitivity than others, with instrumental-based analyses in particular giving lower sensitivity estimates. 3/5
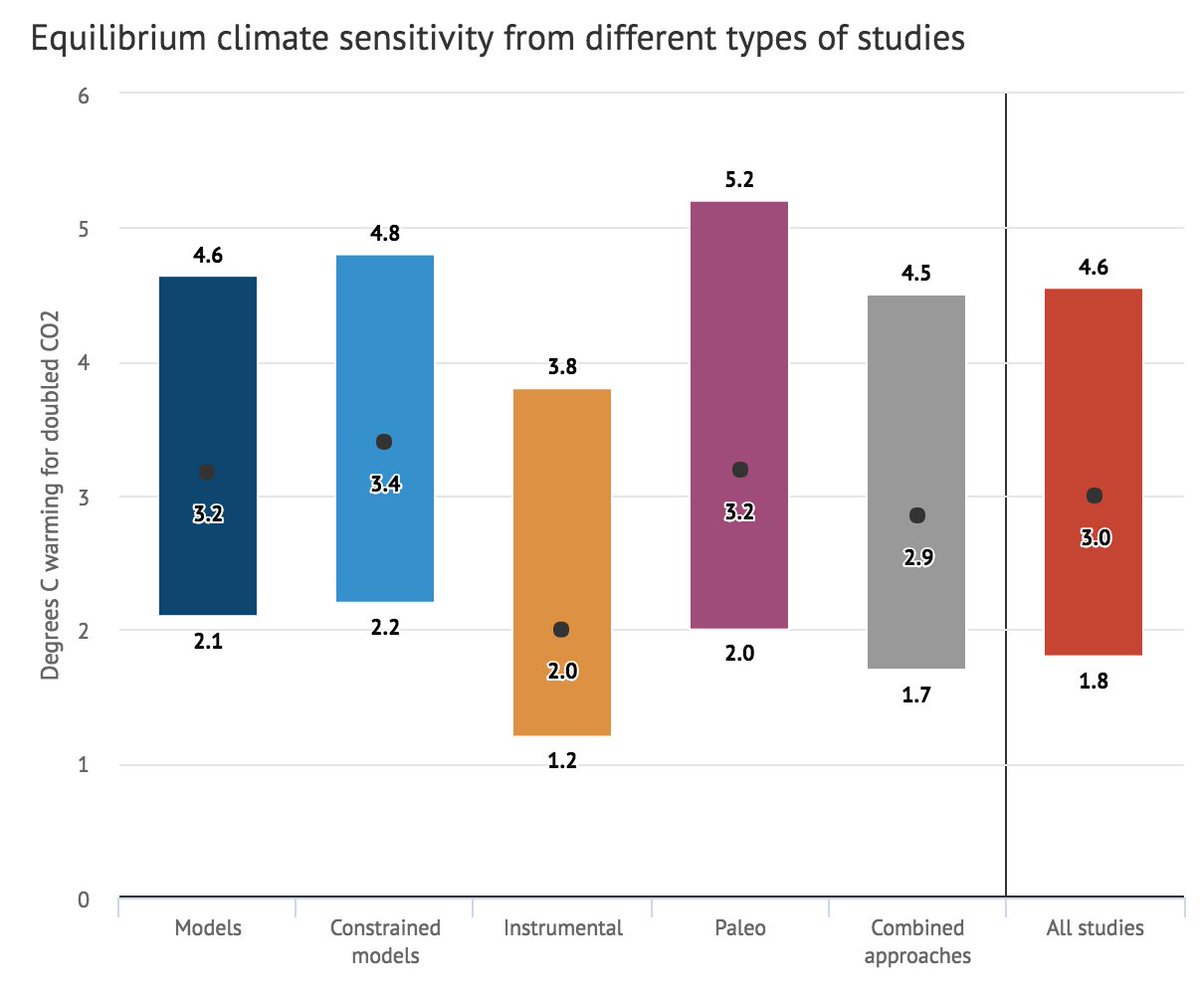
However, many scientists have criticized instrumental approaches for using incomplete observational data, not accounting for the changing nature of climate feedbacks over time, and measuring a state of the earth’s climate far from equilibrium. 4/5
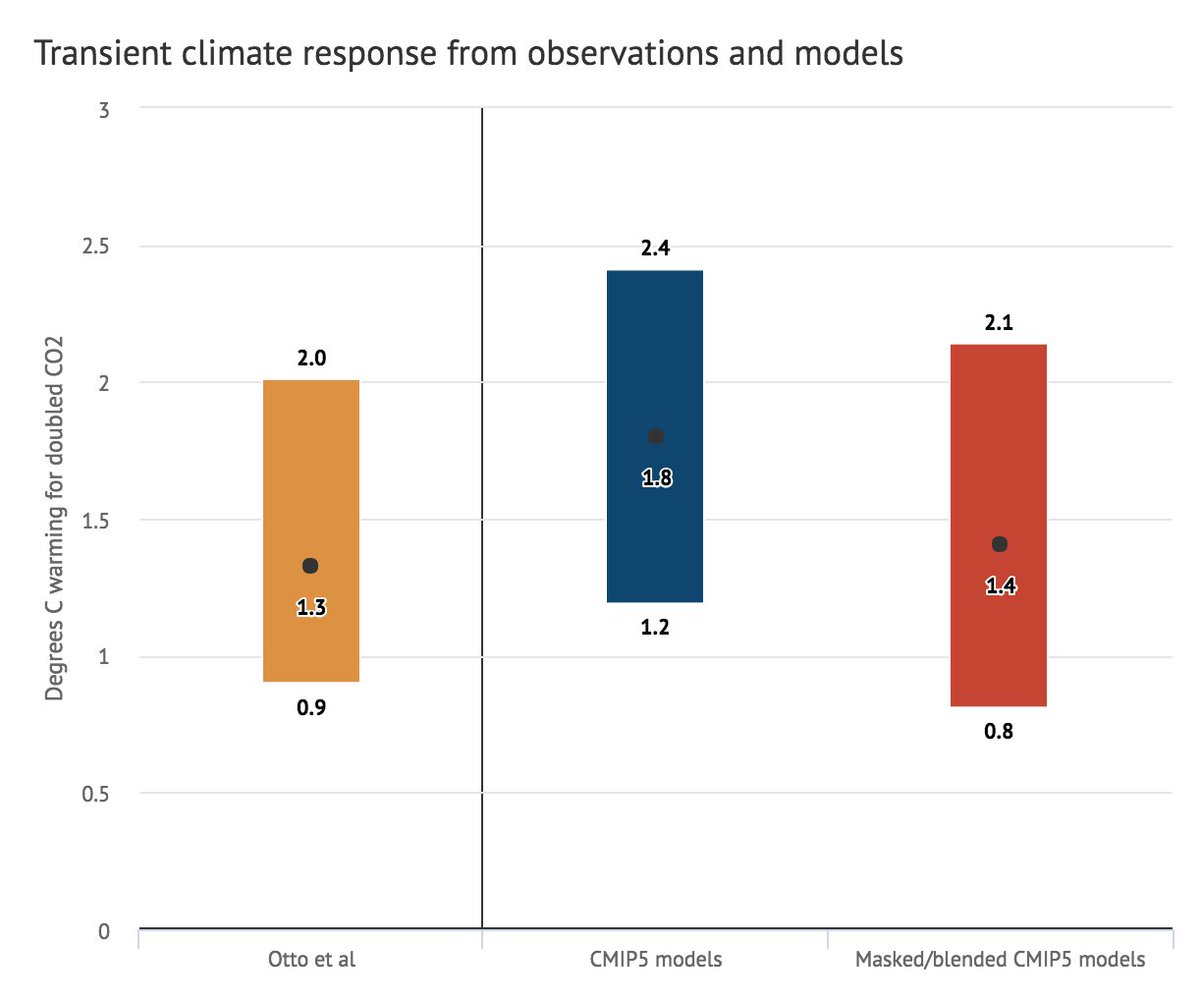
In particular, there appears to be a pattern of sea surface temperatures and tropical cloud cover over the last few decades that gives an appearance of lower sensitivity in both observations and observationally-forced models but is not necessarily related to sensitivity 5/5
As @DrKateMarvel and colleagues suggest, “the specific internal variability experienced in recent decades provides an unusually low estimate of ECS”.
And helpful comments/reviews from @Knutti_ETH, @karmour_uw, @DrKateMarvel, @AndrewDessler, and others.

Great stuff, though I suspect that Lewis and Curry would argue that their latest paper attempts to account for some of the recent arguments about why estimates from the instrumental record may be biased low.
True, though there are likely some things that instrumentally-based estimates simply cannot capture. This RealClimate post that includes Lewis’ comments provides some useful background:
http://www.realclimate.org/index.php/archives/2017/08/sensible-questions-on-climate-sensitivity/
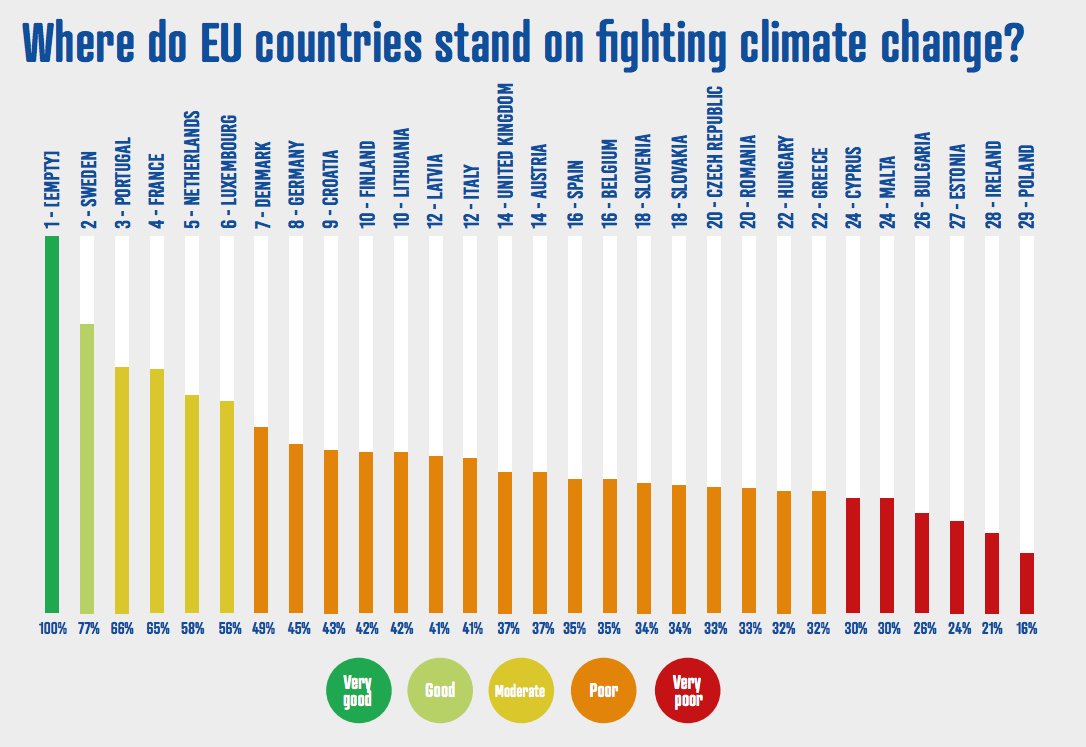
Today I am leaving the topic of climate sensitivity as an open thread, so I may add more opinionated but scientifically sound comments to this post in the next day or two. The best advice all climate scientists are giving is to keep carbon levels as low as humanly possible. Sadly, on the mitigation front, the war is being lost:

………………………………………………….
Heat episode #3 is declining east of the Rockies but will be ramping up in the West the next few days. Notice heat watches have been posted in the Southwest by the National Weather Service. Heat advisories remain around the St. Louis area and in the Southeast Atlantic:
 On Wednesday we will see one more dangerously hot day in the Southeast while heat increases in the Southwest:


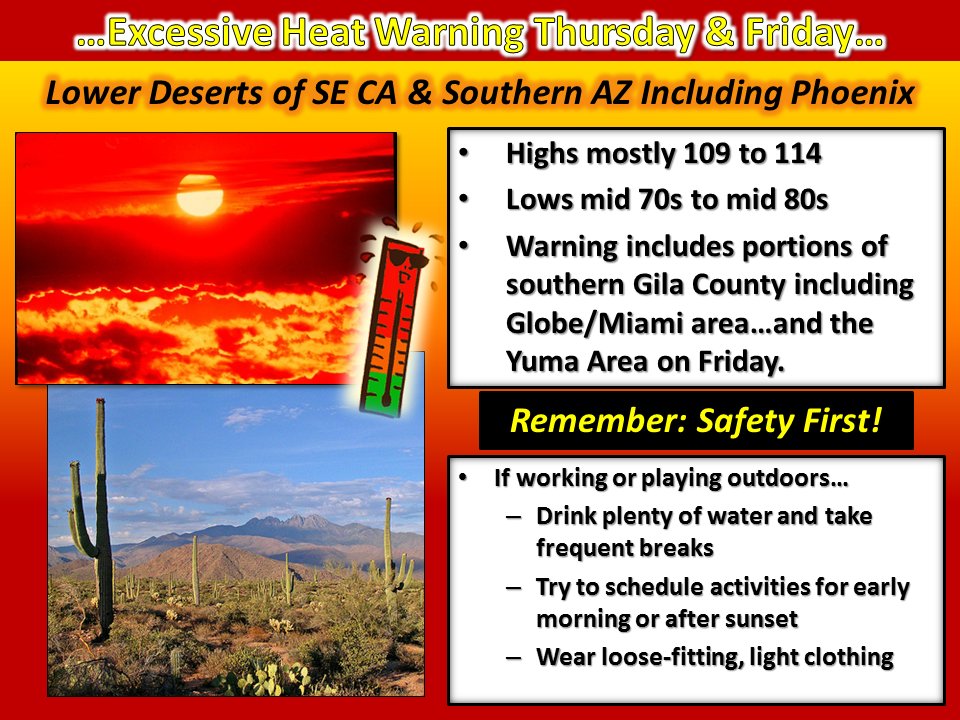
An Excessive Heat Warning has now been issued for Thursday and Friday (upgrading an earlier Watch) and it includes the greater Phoenix metropolitan area as well as the Globe area and the Imperial Valley…and the Yuma Area on Friday. Please stay well-hydrated!

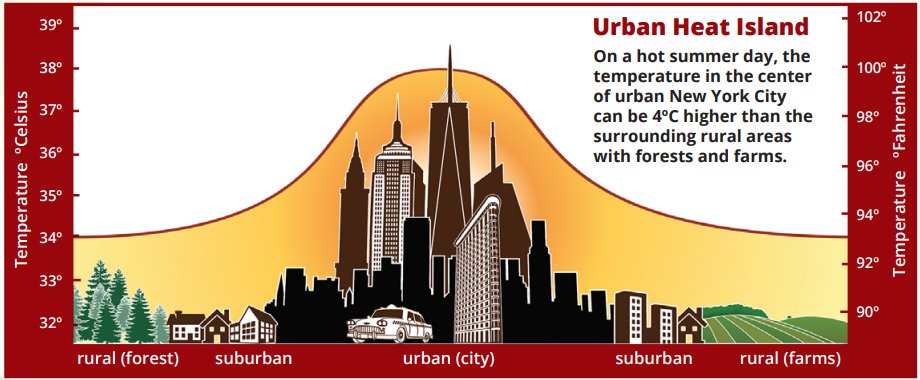
Did you know that cities can be up to 7° warmer than neighboring grassy areas, such as farms or parks? Click on the link for more info. #HeatScience #gawx
https://earthobservatory.nasa.gov/eokids/pdf/EOKids_201701_UHI.pdf …
(If you like these posts and my work please contribute via the PayPal widget, which has recently been added to this site. Thanks in advance for any support.)
The Climate Guy