Tuesday September 18th… Dear Diary. The main purpose of this ongoing post will be to track United States extreme or record temperatures related to climate change. Any reports I see of ETs will be listed below the main topic of the day. I’ll refer to extreme or record temperatures as ETs (not extraterrestrials)😊. Here is today’s main climate change related topic:
Buckle Up…Worldwide Cooling Trend About To End
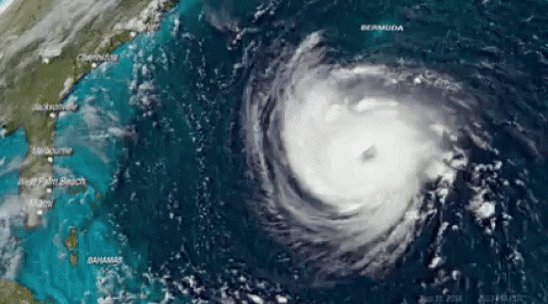
Today both NASA and the National Center for Environmental Information have wrapped up global statistics for the planet through August 2018. The climate and world community were aghast from 2014-2016 seeing one world record broken after another as global temperatures spiked in conjunction with a very strong El Nino. As expected, the Earth’s “fever” broke in 2017 as the strong El Nino ENSO phase transitioned to a weak LA Nina phase. Nevertheless, despite slightly cooler global averages, extreme warmth occurred during the summer months on land across the Northern Hemisphere. Monstrous heat waves occurred both in Europe and in portions of the United States and Canada in 2018 exacerbated by carbon pollution.. Higher sea surface temperatures than average occurred across the northwest Atlantic by about 2-4F playing a big role in making Florence a more powerful storm (see: https://www.wunderground.com/cat6/Climate-Changes-Influence-Hurricane-Florence-Wetter-and-Larger-Storm). My big question going forward is whether or not the planet will have to face the consequences of additional warming, spiking temperatures back to 2016 levels are even higher in 2019 and 2020. Let’s briefly explore trends by carefully looking at some graphs on today’s post.
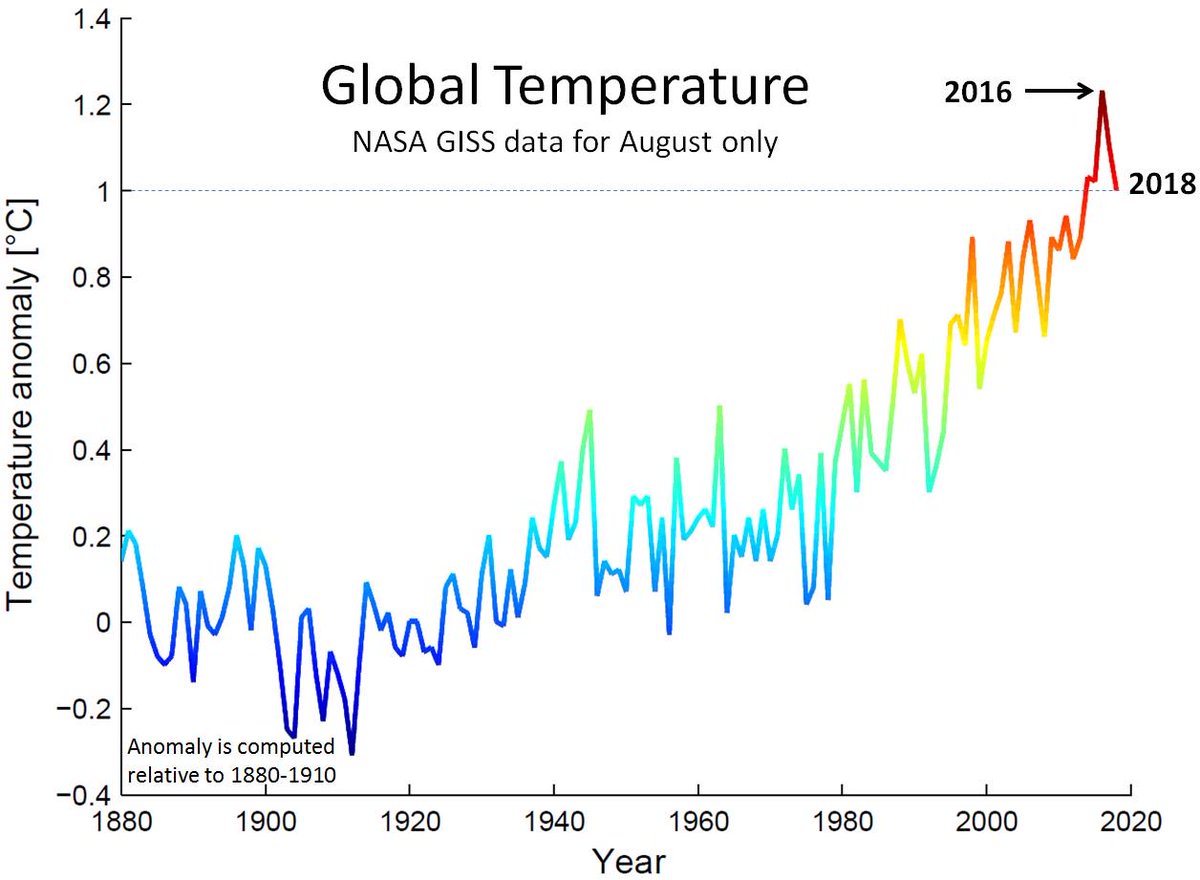
This type of chart has recently been added to NASA’s statistical arsenal visually showing the planet’s warming trend using slightly different colors for each years worth of data:
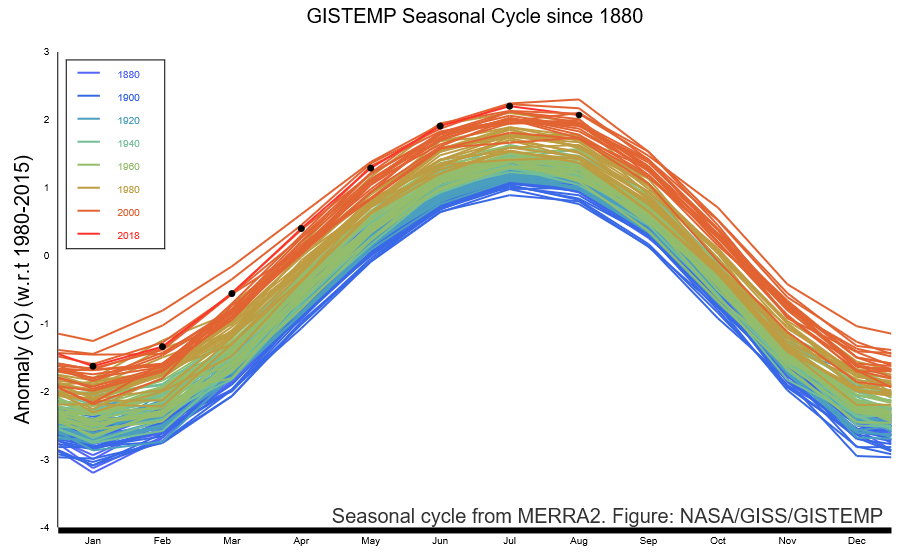
Notice that through August 2018 this year is just a hair under the top lines on the above chart. As far as August goes it’s ranked as such:

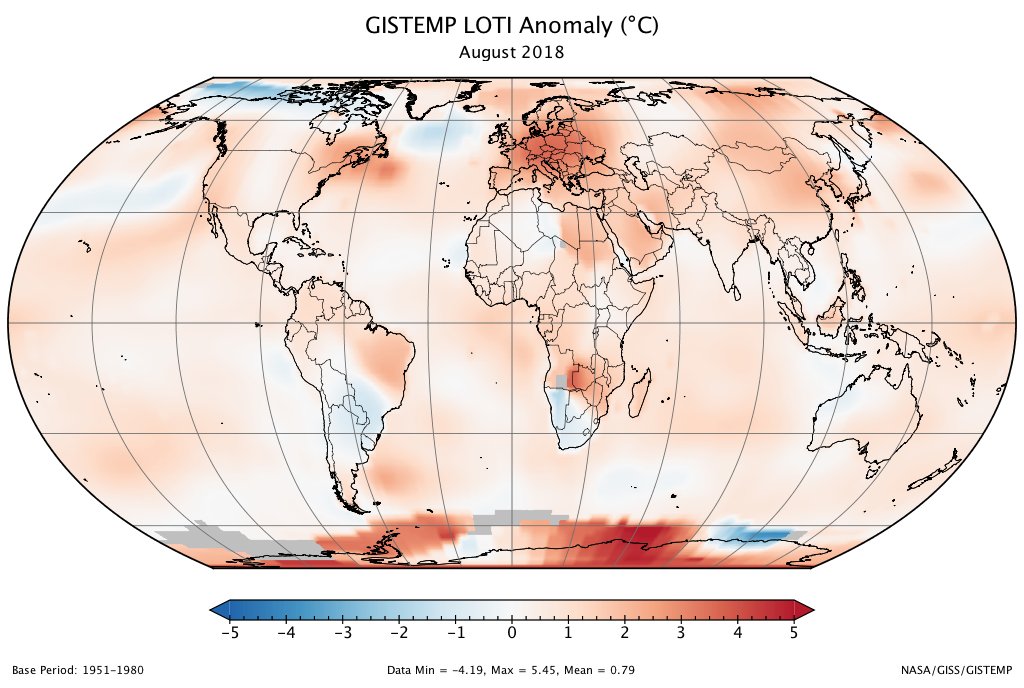
The latest GISTEMP surface temperature analysis update has been posted. The global mean temperature anomaly for August 2018 was 0.77°C above the 1951-1980 average. https://go.nasa.gov/2PakncL

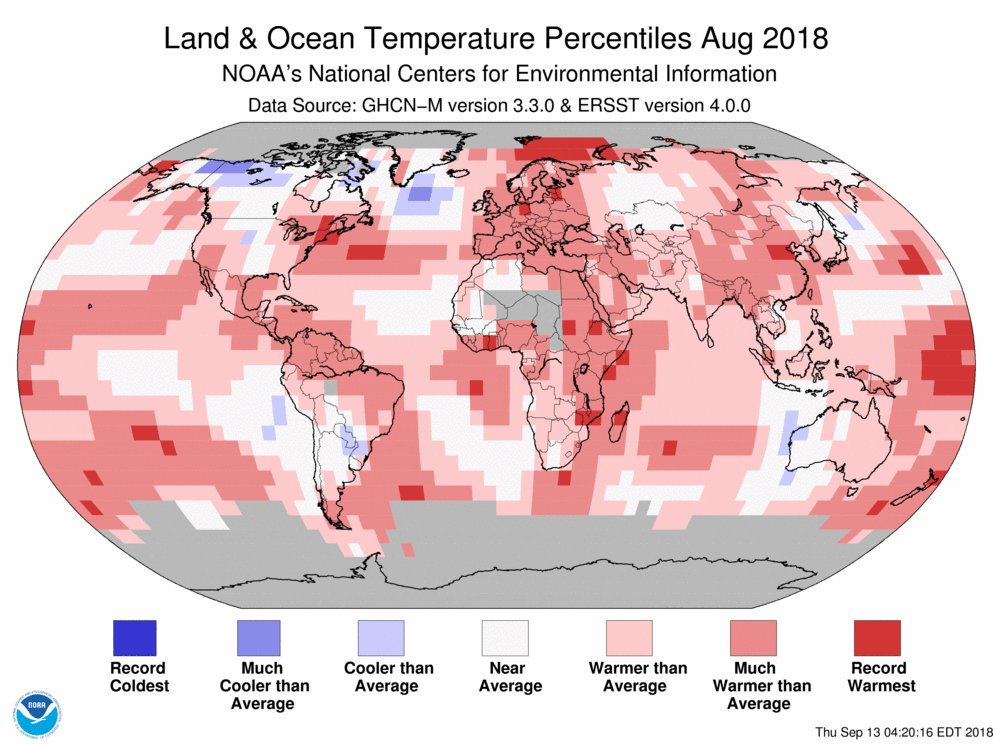
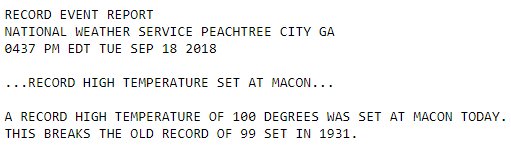
At 1.33°F above average, the August 2018 global temperature was the 5th highest for August on record: http://bit.ly/Global201808 #StateOfClimate


(As usual, this will be a fluid post in which more information gets added during the day as it crosses my radar, crediting all who have put it on-line. Items will be archived on this site for posterity.)

Please donate for those affected by #Florence but check first with this organization, which provides reliable info on what percent of donations go to those in need vs. what percent goes to salaries, administrative costs, etc. My go-to. #Florence #HurricaneFlorence

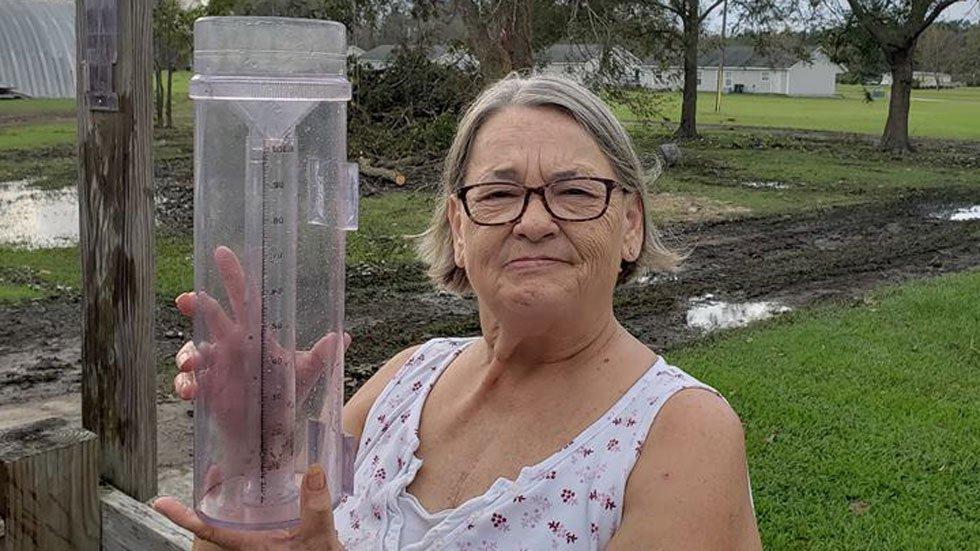
What is it like to measure 34 inches of rain in a #hurricane? @bhensonweather spoke with the N.C. observer who did so during #Florence. https://wxch.nl/2QGwkaD

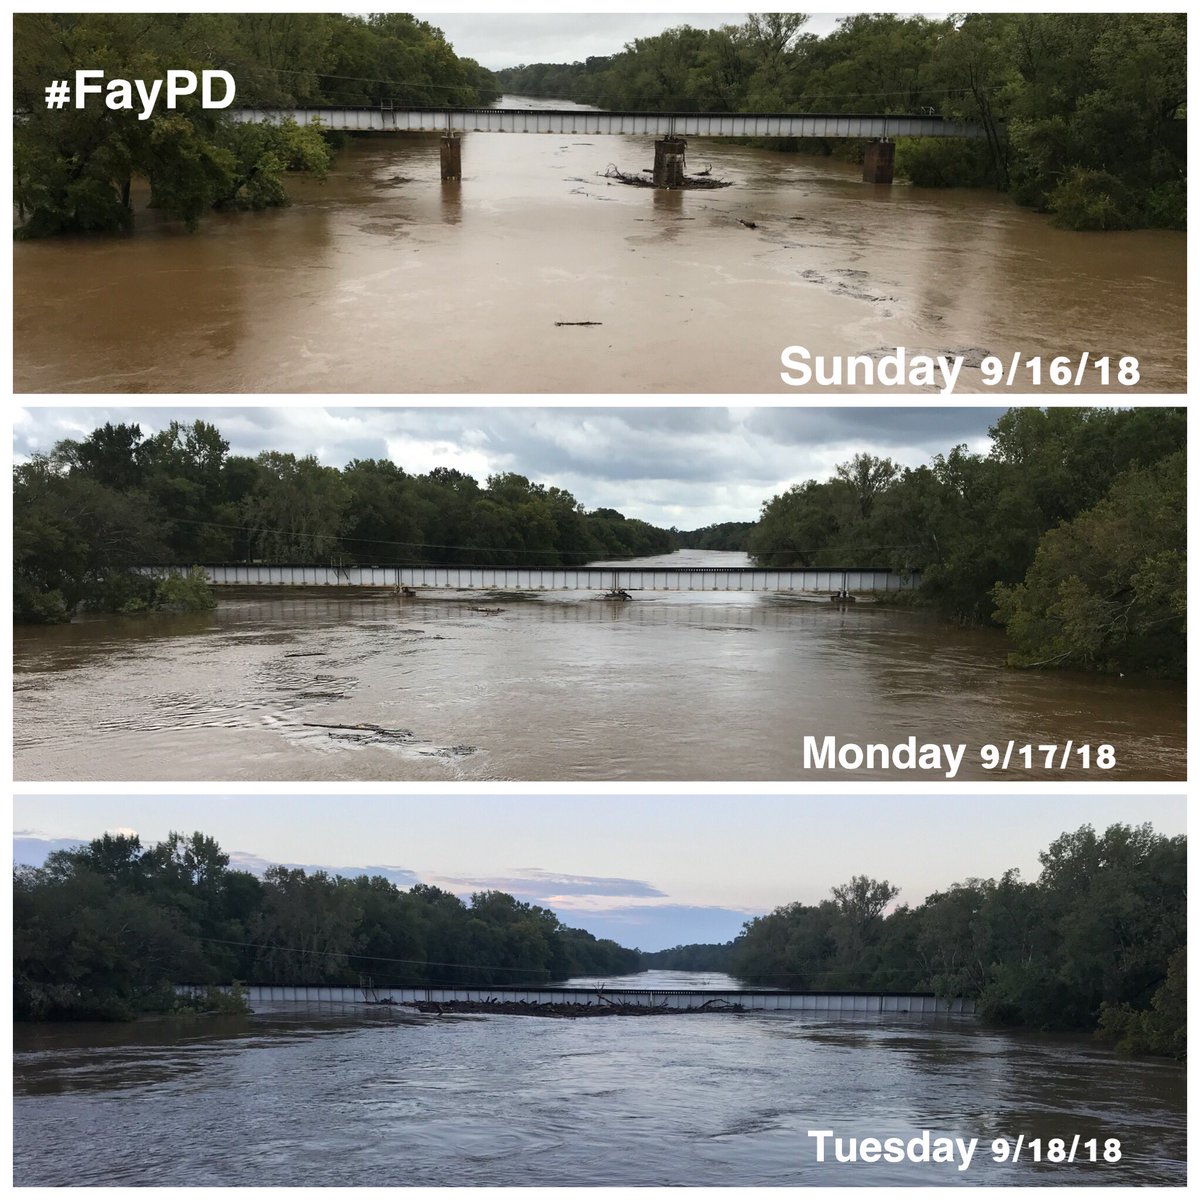
You can clearly see the water levels rising in Cape Fear River as we compare photos from Sunday to Today. #capefear #Florence #ReadyNC #ReadyFay

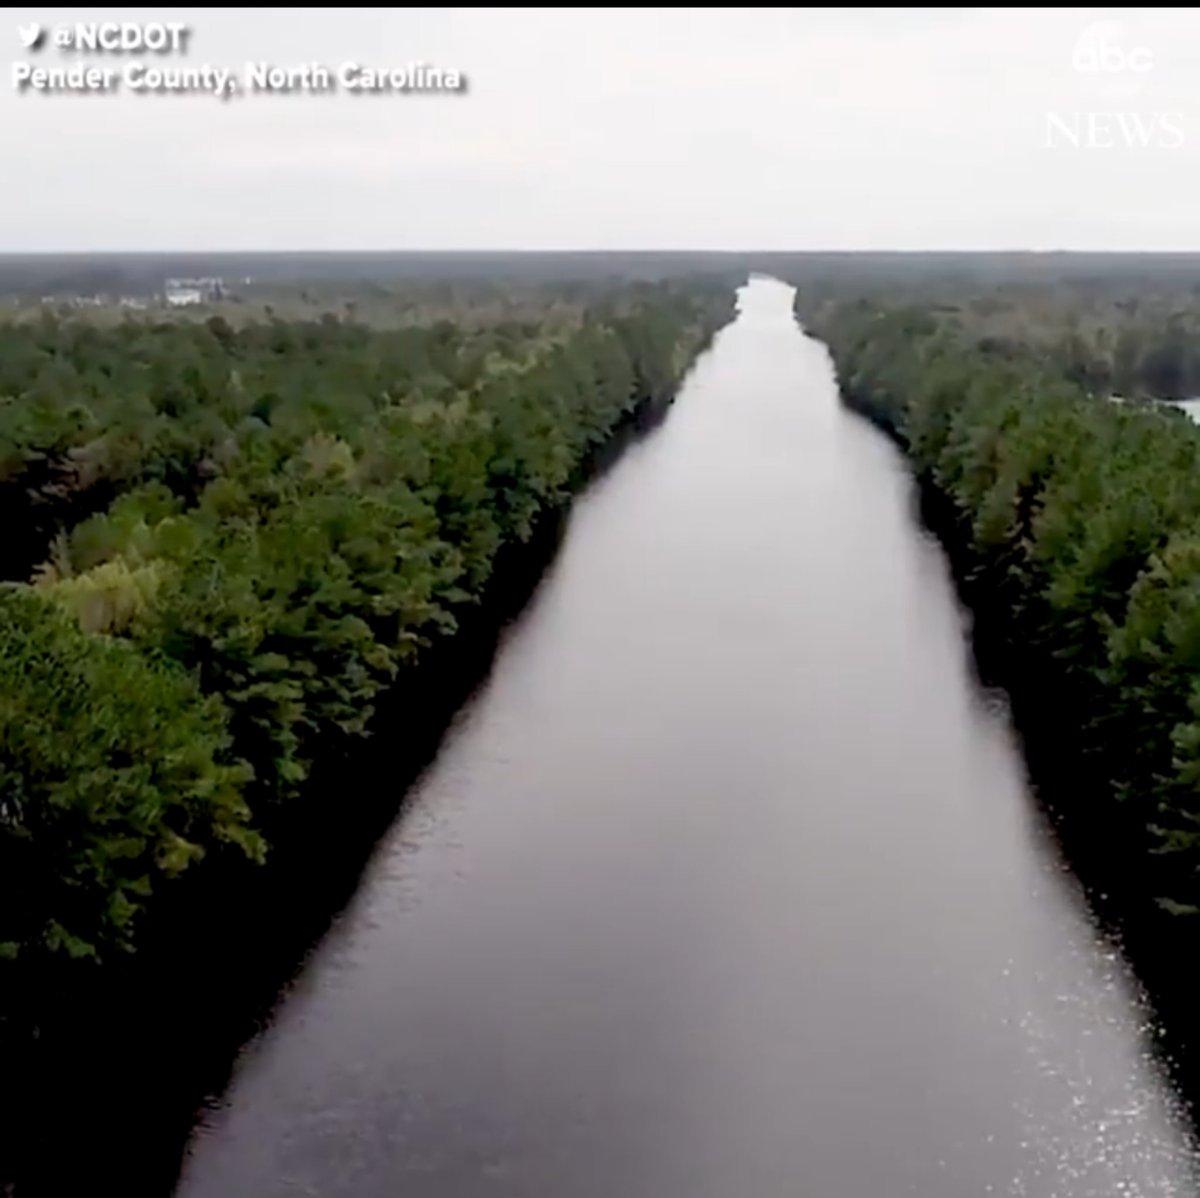
That’s not a river. It’s I-40 into Wilmington,NC.

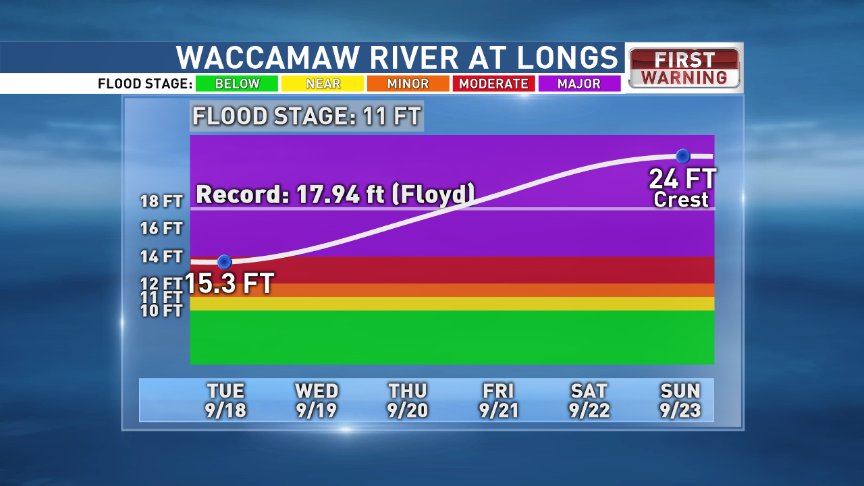
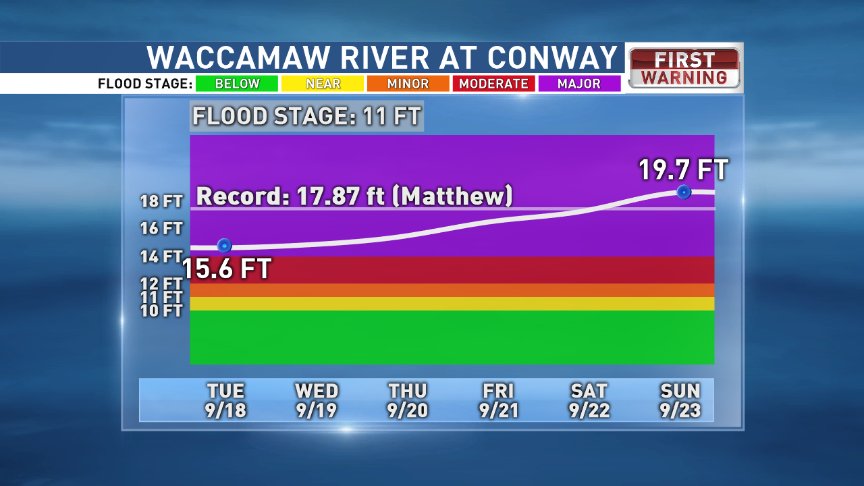
Waccamaw River at Longs & Conway will crest higher than they ever have in recorded history. In Longs, crest is Sat/Sun at 24 ft…6 ft higher than hurricane FLoyd. In Conway, expected to rise to 19.7 ft Sunday then close to 21 ft. NEXT Tue/Wed…3 ft higher than Matthew #scwx

As Hurricane Florence barreled toward the coast, a trucker from Tennessee raced into four South Carolina towns to evacuate animal shelters. Using his school bus, he evacuated 64 dogs and cats, and it turns out it’s not the first time he’s done so.
https://weather.com/news/news/2018-09-18-trucker-rescues-64-pets-hurricane-florence

Amazing graphic showing how quickly the soil of NC and SC became saturated with the nearly constant rain. #Florence
Soil moisture transformation from dry (brown/orange) to near saturation (purple/blue) over North Carolina associated with flooding rainfall from Hurricane #Florence (SPoRT-LIS product incorporating #MRMS precipitation). @NASA_LIS pic.twitter.com/SRgPnz5nL6
— NASA SPoRT (@NASA_SPoRT) September 18, 2018

Natural climate oscillations in north Atlantic linked to Greenland ice sheet melt: ScienceDaily https://www.sciencedaily.com/releases/2018/09/180918110838.htm … |


#Climate change makes hurricanes way more intense http://ow.ly/IlTm30lRhY9 via @AP
 NWS AtlantaVerified account @NWSAtlanta
(If you like these posts and my work please contribute via the PayPal widget, which has recently been added to this site. Thanks in advance for any support.)
The Climate Guy