Sunday September 30th… Dear Diary. The main purpose of this ongoing post will be to track United States extreme or record temperatures related to climate change. Any reports I see of ETs will be listed below the main topic of the day. I’ll refer to extreme or record temperatures as ETs (not extraterrestrials)😊. Here is today’s main climate change related topic:
New Mexican Record Count Findings
It’s been a while since I presented any of my new work, which always involves counts of record temperature data from the National Center For Environmental Information: https://www.ncdc.noaa.gov/cdo-web/datatools/records. After archiving counts, which includes ties, for the United States, Canada, and Russia, I have next turned to a country located in more southern climes where I expected to see slightly less of a warming trend than that of more northern countries, Mexico. I was a little surprised to find an even steeper climb in ratios than in the other three datasets with one big caveat, which I will explain later in this post. It’s been thought that areas at higher latitudes have been warming faster than those in more southern climes. No matter where I look, though, a steady warming trend due mostly to carbon pollution appears since the 1970s and 1980s.
As an aside, it usually takes me a good two months during which I set aside about eight hours per week from my time to glean data and process just counts alone in Excel files from the linked NCEI surface records site. If anyone wants to try their hand at recording data by state, country, or even city, drop me a note and I can give pointers to get you started.
Here is that “new” gleaned data for Mexico, which actually has been contained within the site but not prcessed for years:


Mexican counts look significant enough for a more thorough study back to about 1950. Here is the big caveat: Why the tail off after the 1990s? “Mexico’s Servicio Meteorologico Nacional has had some pretty severe challenges in the last 20 years, so there are surely fewer stations today than there were in 1998. However, these tend to manifest as a ramp-down, rather than a mass closure,” according to Deke Arndt from NCEI. Obviously, ratios for the 2010s are currently higher even than those of the 2000s, which was the warmest decade for the planet in hundreds of years.
Before pressing on to tropical and climate news for the day, here are the other four datasets for your perusal:


Canadian counts looked significant enough for a study from 1920 to the present.


Russian record counts look significant enough for a study frim about 1930 to the present.


Of course, U.S. data has already been used for two of Dr. Jerry Meehl’s studies of record count ratios, one in 2009 that I was a part of, and another in 2015.
So which country would you like the old Climate Guy to tackle next? You can let me know by replying to this post.
Here is some of today’s tropical, weather, and climate news:
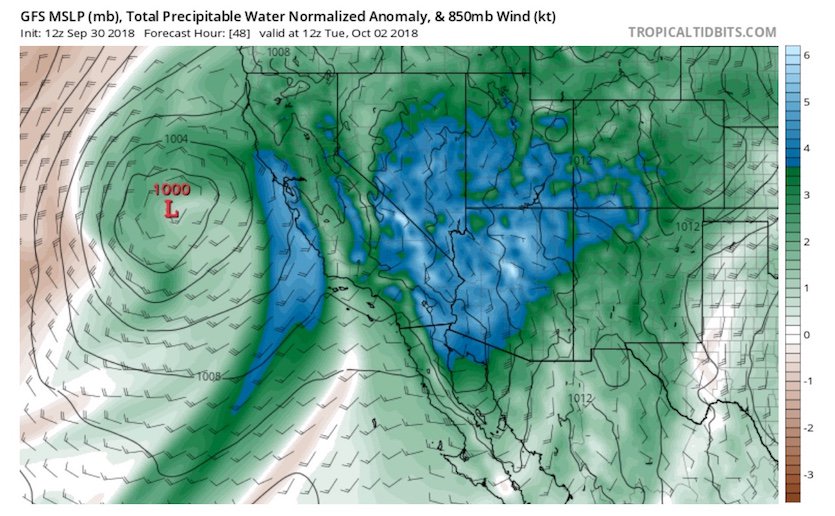
Flash floods are possible from California to Utah as #Rosa sweeps inland, bringing record amounts of moisture for October. https://bit.ly/2y2Exh0
Must-read piece on climate change, sea level rise and American environmental refugeeism by Pilkey senior and junior (no, not “Pielke senior and junior”–totally different!):
4:45 PM – 30 Sep 2018
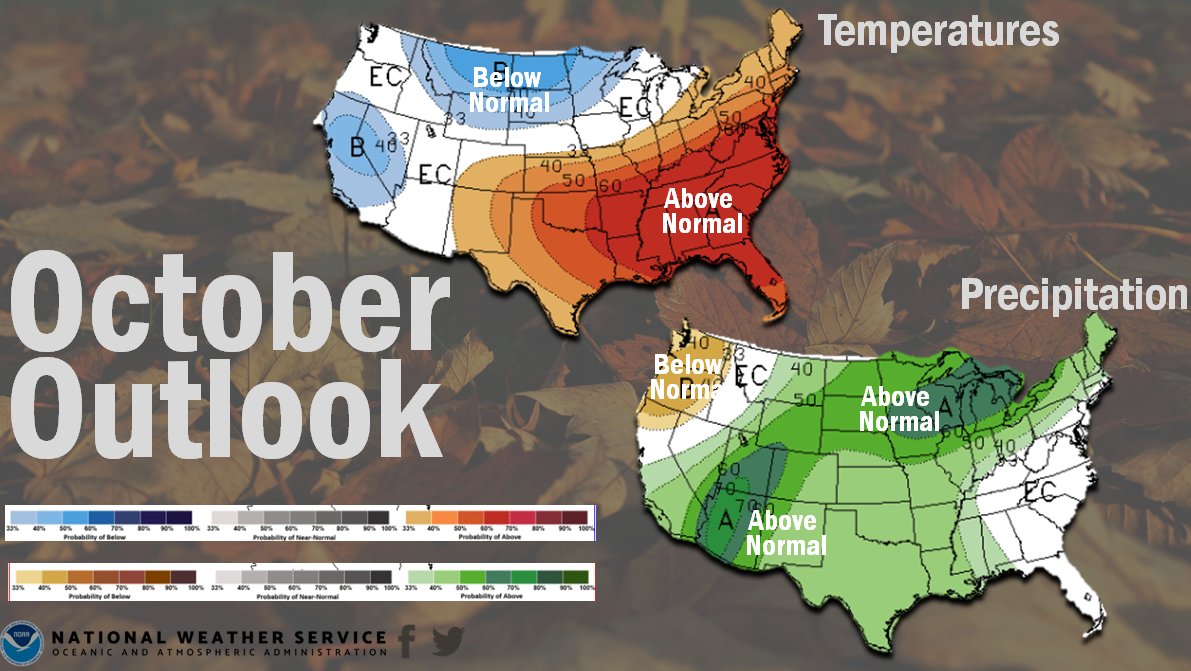
We’re closing the books on September tonight. So what does October have in store for us?
Take a look at the October outlook for temperatures and precipitation issued by the @NWSCPC.
(As usual, this will be a fluid post in which more information gets added during the day as it crosses my radar, crediting all who have put it on-line. Items will be archived on this site for posterity.)
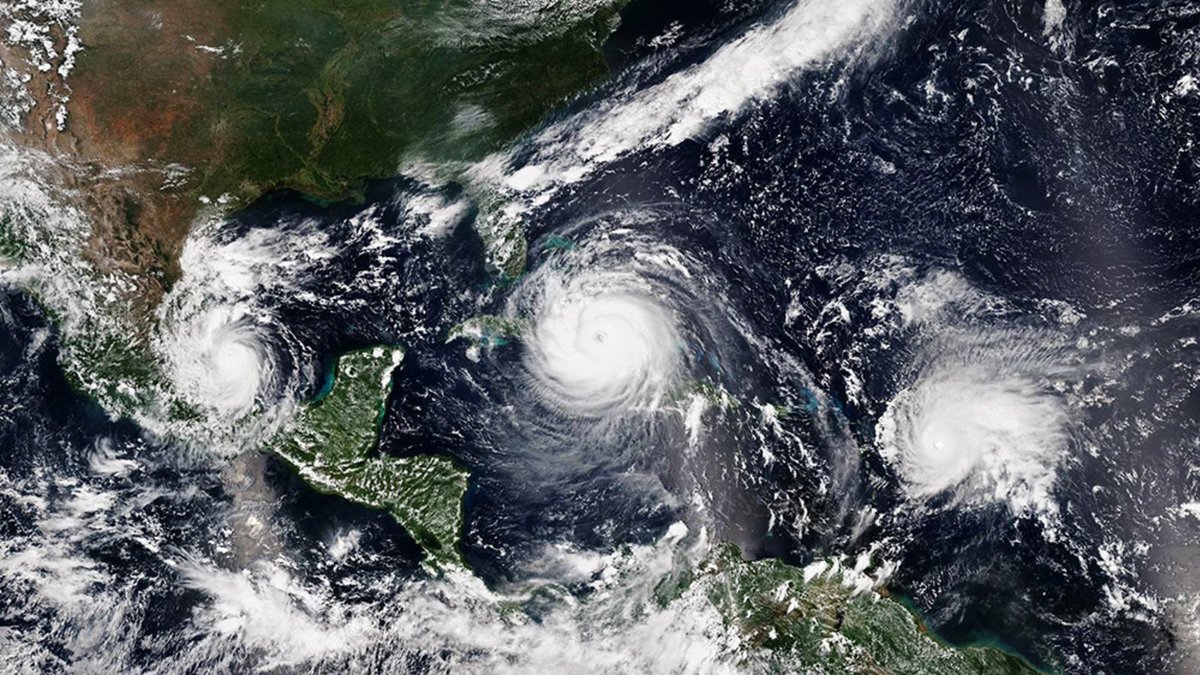
Trami is moving very quickly to the NE, and will continue as a powerful subtropical cyclone until it reaches the Pacific. Then Trami will become extratropical and continue it's NE direction. Typhoon Kong Rey lurks in the distance and could impact this region by next week. pic.twitter.com/9UQCB36zwB
— Scott Cook (@scook2214) September 30, 2018
*World Weather* Effects of #Typhoon #Trami in Shizuoka, Japan today, Sept 30. Report: Japan Tomo pic.twitter.com/etdJydAoCr
— severe-weather.EU (@severeweatherEU) September 30, 2018
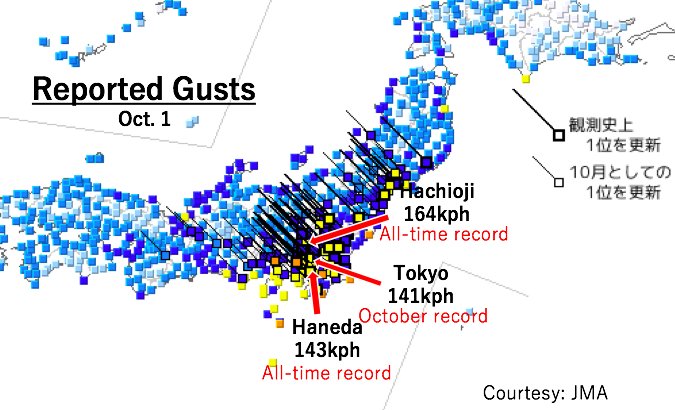
Wind gust to 88 MPH measured in Tokyo with Typhoon #Trami.
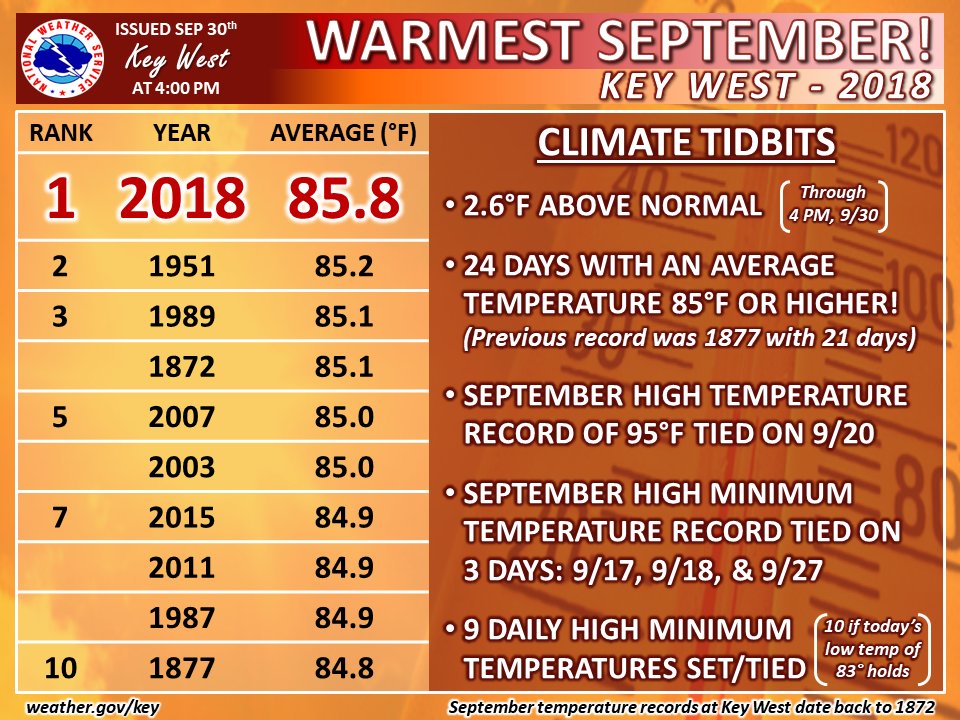
Here is some September 2018 climatology:
Shattering a summer monthly record by this much is quite remarkable in #KeyWest– 0.6F is such a large margin when surrounded by water.
(If you like these posts and my work please contribute via the PayPal widget, which has recently been added to this site. Thanks in advance for any support.)
The Climate Guy


