Friday December 6th… Dear Diary. The main purpose of this ongoing post will be to track United States extreme or record temperatures related to climate change. Any reports I see of ETs will be listed below the main topic of the day. I’ll refer to extreme or record temperatures as ETs (not extraterrestrials).😉
Closing Out Warm Statistics For The 2010s Via Climate Central
Dear Diary. A decade ago I was keenly aware that the 2000s would be declared as the hottest decade for the planet in recorded history, having also helped to demonstrate scientifically that in the United States there was an appropriate 2 to 1 ratio of daily record high counts to lows for the first ten years of the 21st century. Time really flies. We only have a scant three weeks before the decade of the 2010s is history, and we begin taking climatological statistics for the 2020s.
Here’s a big hint looking at myriad sets of data. I have no doubt that the 2010s overall, except in a few locations across Earth, will be declared warmer than the 2000s. Climate Central has already posted some great preliminary findings, reinforcing the fact that carbon pollution is warming our world:
https://climatecentral.org/gallery/graphics/decades-of-warming-in-u.s.-cities
Decades of Warming in U.S. Cities
- Published: December 4th, 2019
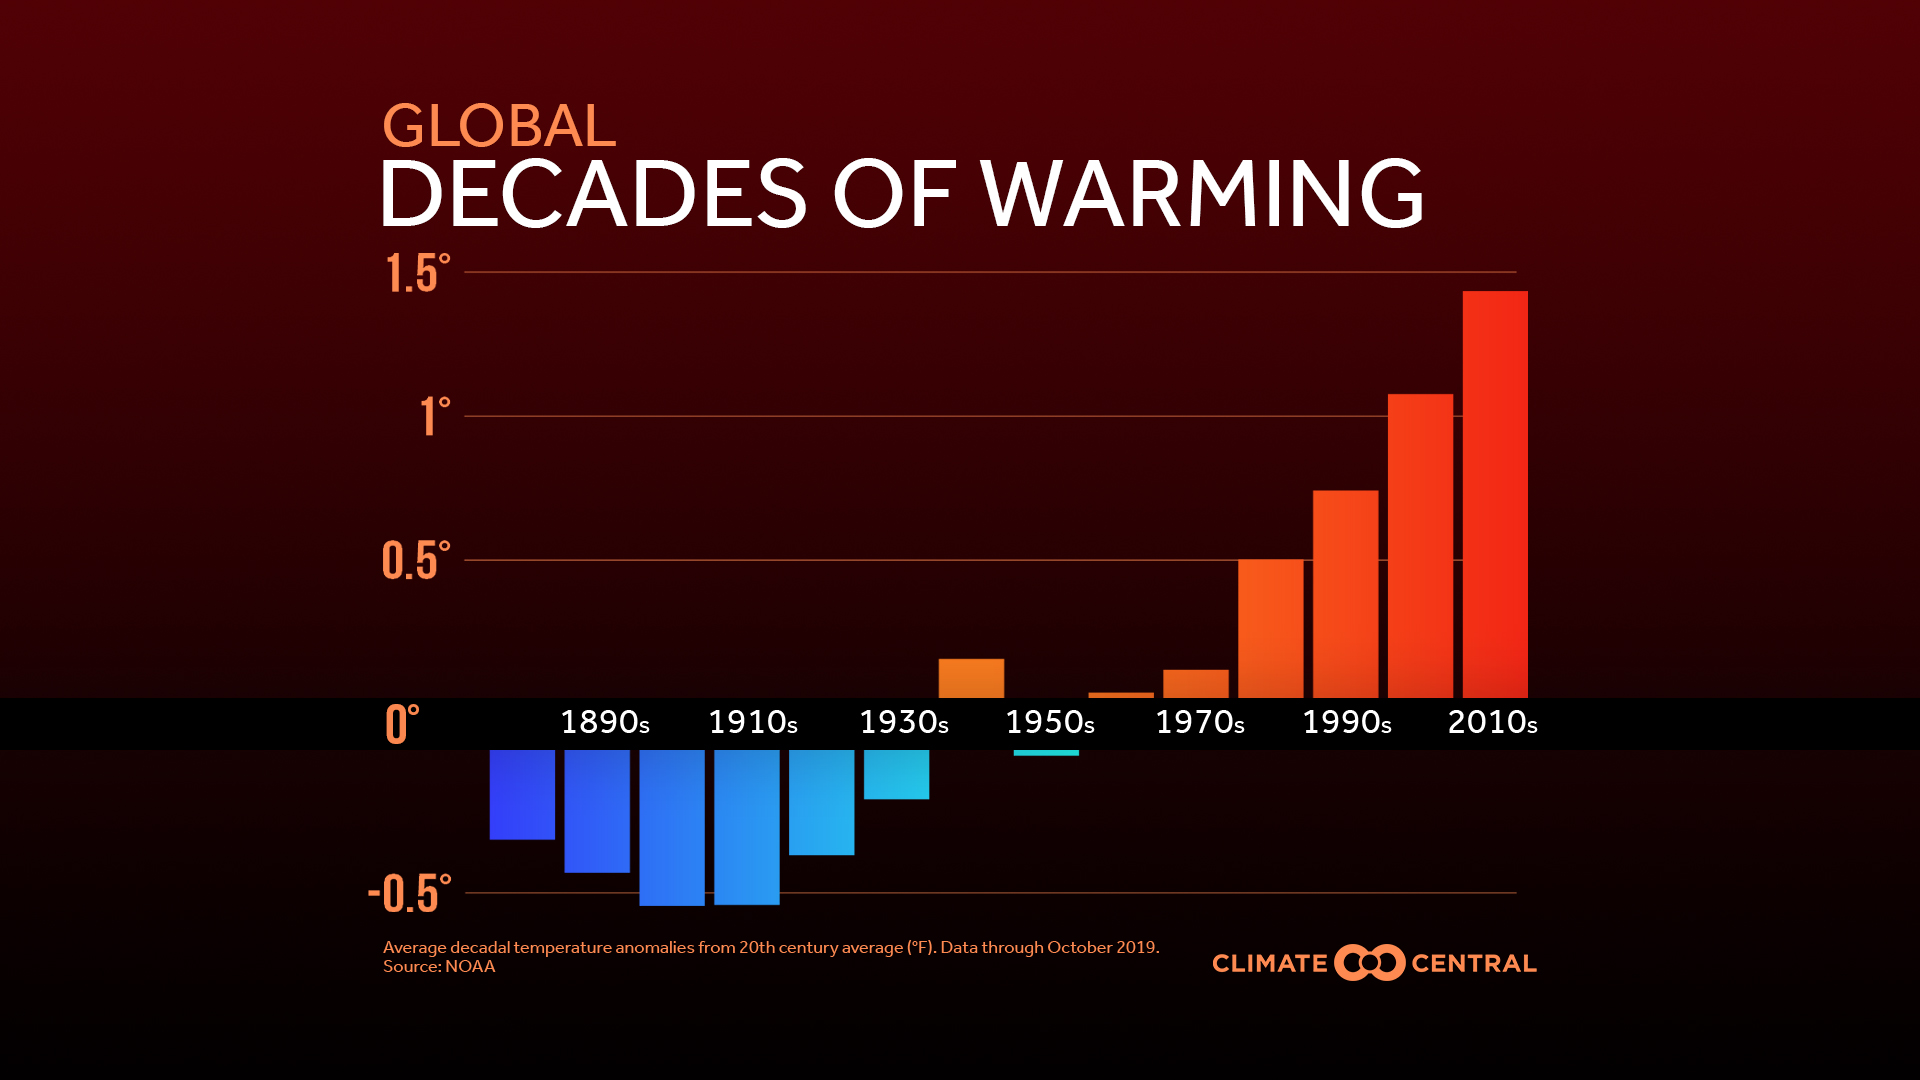
December has arrived—and with it, the last month of the 2010s. Though hindsight isn’t quite 2020 yet, climate change has left plenty to remember over the past 10 years. This release covers warming temperatures by the decade, with clear trends at the local, national, and global scales.
Find all JPG and PNG versions here
Locally, the 2010s have been the warmest decade for 222 of the 244 cities analyzed. (We focus on the past five decades for consistent local data). In all but three cities (99%), the past decade has been warmer than the first (1970s in most cases). That difference is largest in the Southwest, led by Reno and Las Vegas, Nev.; El Paso, TX; and Phoenix and Tucson, Ariz. These results match our fastest-warming cities report and local records data—which include each station’s full period of record. And though urban heat islands may intensify local warming, they can’t explain all of it.
| Fahrenheit – With title: JPG PNG | No Title: JPG PNG |
| Celsius – With title: JPG PNG | No Title: JPG PNG |
National and global trends are even stronger—as much as 0.5°F per decade. If this trend continues, it won’t take long to blow past the Paris Agreement’s limits of 1.5-2°C (2.9-3.8°F) above preindustrial levels. Global warming is already more than halfway there.
The warming has widespread impacts, affecting this decade like never before. Billion-dollar weather and climate disasters have cost the U.S. more than $700 billion (inflation-adjusted) in the 2010s, far eclipsing previous decades. Arctic sea ice seasons have been melting to record-low extents, most recently in October. Coral reefs suffered severe bleaching, which is now five times more common than 40 years ago. And as of last fall, five of eight hurricane basins had recorded their strongest storms in the 2010s. Behind these statistics are devastating consequences for humans and all life on Earth, as documented by the newest decade of reports from the IPCC, National Climate Assessment, and many others.
………………………………………………………………………….
I seriously doubt that we will see a subsequent decade during the 21st century that has planetary averages that are even slightly cooler looking at trends. The 2040s should be warmer than the 2030s, which should be warmer than the 2020s, etc. baring, God forbid, nuclear winter or a strong series of volcanic eruptions. We can, though, limit the severity of the warmth and associated climate disruption through keeping fossil fuels in the ground. After all, it will be a better world for us all if we can limit global averages to under +2.0°C above preindustrial conditions.
Here is more climate and weather news from Friday:
(As usual, this will be a fluid post in which more information gets added during the day as it crosses my radar, crediting all who have put it on-line. Items will be archived on this site for posterity. In most instances click on the pictures of each tweet to see each article.)
(If you like these posts and my work please contribute via the PayPal widget, which has recently been added to this site. Thanks in advance for any support.)
Guy Walton- “The Climate Guy”