Thursday July 9th… Dear Diary. The main purpose of this ongoing blog will be to track United States extreme or record temperatures related to climate change. Any reports I see of ETs will be listed below the main topic of the day. I’ll refer to extreme or record temperatures as ETs (not extraterrestrials).😉
Main Topics: Prolonged Historic U.S. Heat Wave…Update #5/Early July Record Scoreboard Update And Climatological Review
Dear Diary. Today in addition to assessing our heat wave I will present monthly climatological data using my record scoreboards.
As usual to start this particular post, let’s have a heat checkup for the United States for the next couple of days. Our low level CAT 1 heat wave is intensifying across some sections of the country with more heat advisories posted this morning than at the same time on Wednesday:

On Friday heat will be intensifying in the Southwest, much of the Plains, and the Southeast:
I anticipate that we will have a CAT2 heatwave by Saturday when our heat dome peaks, producing near all-time records from Arizona eastward through much of West Texas:


About the only major change from yesterday is that the ridge, after diminishing some early next week, will rebuild over the Ohio Valley and Southeast, peaking out a week from Friday:
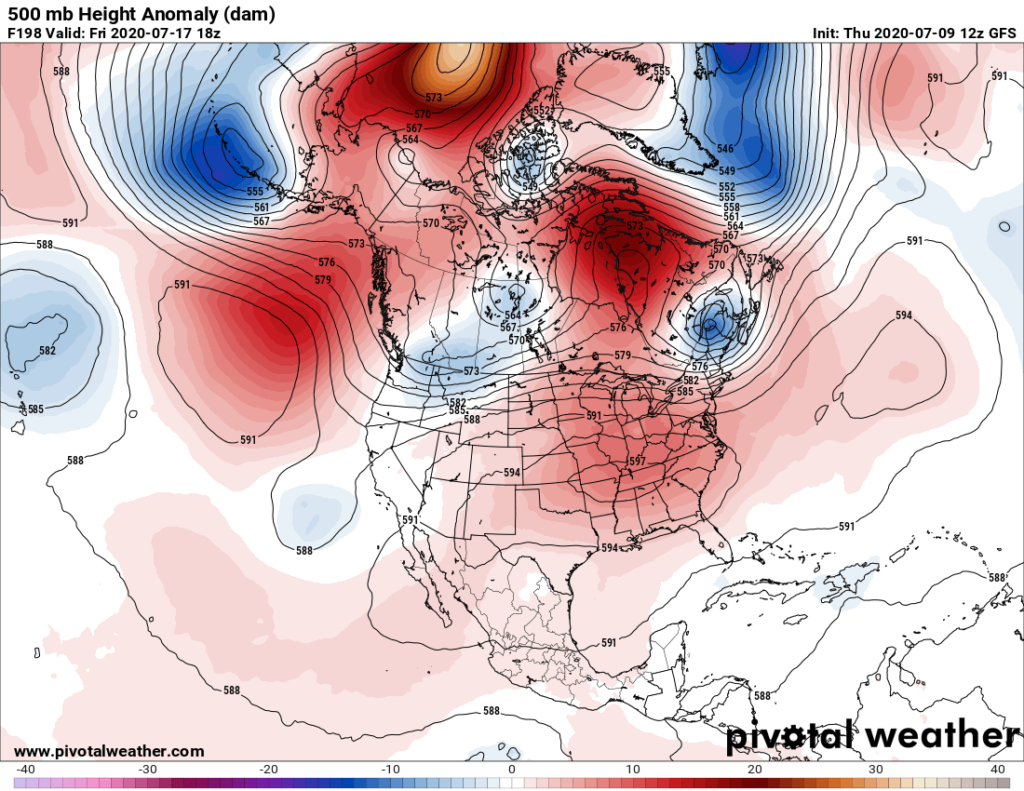
This means that the Southeast where I live will also heat up like the rest of the nation, experiencing some record heat well in excess of 95F.
Unlike many a heat wave in the past in which there was some cooling light at the end of a long tunnel, we just don’t see much relief coming from model ensembles well out past 240 hours:
As always, check in from time to time on this site to see if I have posted any updates.
_____________________________________________________________
And now for that climatological review:
Repeating from June: As COVID-19 ravages the United States and the globe, climate change continues to be a simmering issue, which most news sources have put on the back burner of coverage because of the pandemic. On this site, though, the climate crisis will always make headlines, because it will be with us long after this pandemic abates.
Here on this site we present monthly summaries near the 6th of each month, and each is available if you want to go back through my Extreme Temperature Diary archive.
I’m repeating my mantra from last month:
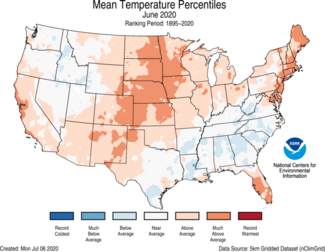
July 2020 got ranked by the National Center for Environmental Information as an above average July, temperature wise, for the lower 48 states, coming in as 103rd coolest or 24th warmest since records began being kept in 1895:
https://www.ncdc.noaa.gov/cag/national/rankings/110/tavg/202006
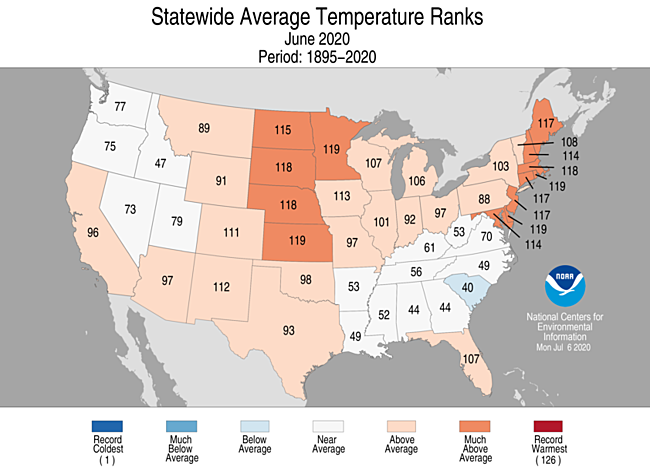
The Southeast was the coolest area of the nation. The northern Plains and Northeast had the most anomalous warmth.
Here are my two U.S. Daily Record Scoreboards updated through 7/7/2020 (data compiled from the following NCEI site):
https://www.ncdc.noaa.gov/cdo-web/datatools/records

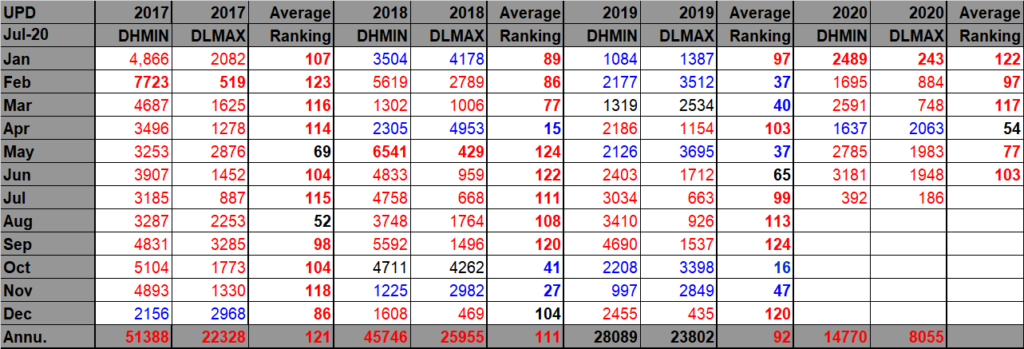
DHMX= Daily High Max Reports. DLMN= Daily Low Min Reports. DHMN= Daily High Min Reports. DLMX=Daily Low Max Reports.
For these data sets all monthly ratios of > 10 to 1 DHMX to DLMN or > 10 to 1 DLMN to DHMX are in bold type. The rankings are for the lower 48 states with the warmest ranking since 1895 of average temperatures being 125 and 1 being the coldest as of 2020. Blue colors represent cold months and red warm. Those months and years with counts close to a 1 to 1 ratio of highs to lows are colored black. Boldly colored months, such as January 2020, have ratios of more than 10 to 1 daily record highs to lows or lows to highs, and are either historically hot or cold, most of which have made news.
July 2020 had approximately a 16-9 ratio of record DHMX to DLMN individual record counts, so the color I used for this month was red on the top chart.
July 2020 had approximately a 31-19 ratio of record DHMN to DLMX individual record counts, so the color I used for this month was red on the bottom chart.
Due to climate change we will see less blue colors on these Record Scoreboards with time.
As stated, the ranking for June 2020 was 103, which was colored red. I color rankings +10 or -10 from the average ranking of 63 black, indicating that these are near average temperature wise.
We are seeing strong indications that July 2020 will be extremely torrid looking at meteorological guidance. It would not surprise me that the month will get ranked as one of the top ten hottest months in recorded history when climatological data gets processed in early August.
Here is much more detailed U.S. climatology as complied by NOAA:
https://www.ncei.noaa.gov/news/national-climate-202006
Assessing the U.S. Climate in June 2020
Contiguous U.S. experienced a warm, dry June, and Alaska ranked seventh wettest for the month

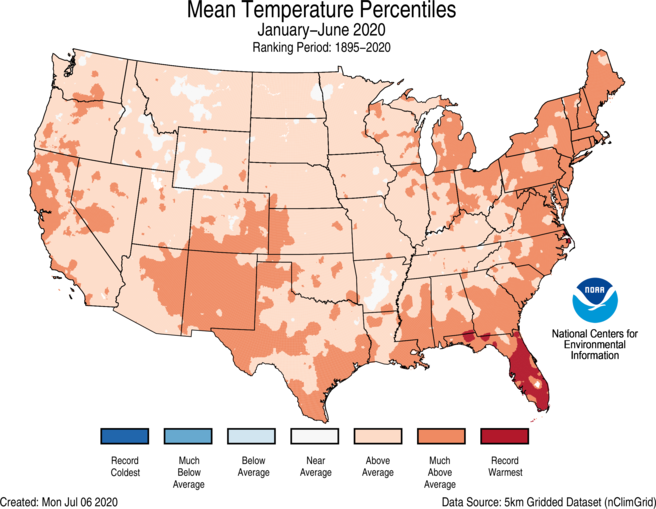
The June contiguous U.S. temperature was 70.3°F, 1.8°F above the 20th-century average, ranking in the warmest third of the 126-year record. The year-to-date average temperature for the contiguous U.S. was 50.0°F, 2.4°F above the 20th-century average, and ranked eighth warmest in the January-June record.
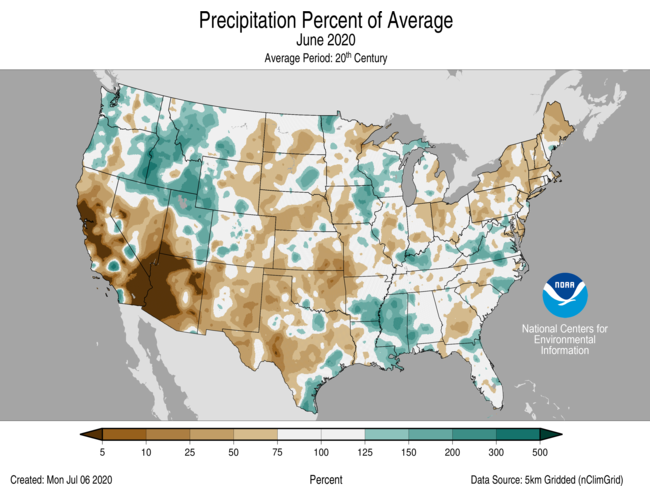
The June precipitation total for the contiguous U.S. was 2.72 inches, 0.21 inch below average, and ranked in the driest third of the 126-year period of record. Despite the dry conditions during June, the precipitation total for January-June was 16.32 inches, 1.01 inches above average, and ranked in the wettest third of the 126-year record.
There were 10 billion-dollar weather and climate disasters identified during January-June, which makes 2020 the sixth consecutive calendar year where 10 or more separate events were identified — a new record. All 10 disasters were due to severe storms with impacts from tornadoes, hail and high wind damage across more than 30 states.
This monthly summary from NOAA National Centers for Environmental Information is part of the suite of climate services NOAA provides to government, business, academia and the public to support informed decision-making.
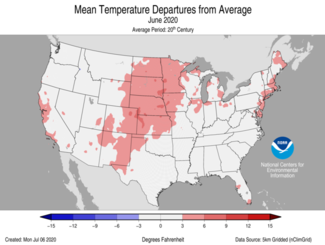
- The primary circulation pattern during June was a ridge over the Great Plains with troughs along the East and West coasts. This brought above-average heat to the central U.S. and kept parts of the West and Southeast cooler than average.
- Above-average June temperatures were observed across portions of the West and Gulf coasts as well as from the Southwest to the northern Plains and from the Great Lakes into New England. Rhode Island, Delaware, Minnesota and Kansas ranked eighth warmest for the month.
- Below-average June temperatures were scattered across portions of the Deep South, Southeast and northern Rockies. However, only South Carolina ranked in the coolest third of its historical distribution for the month.
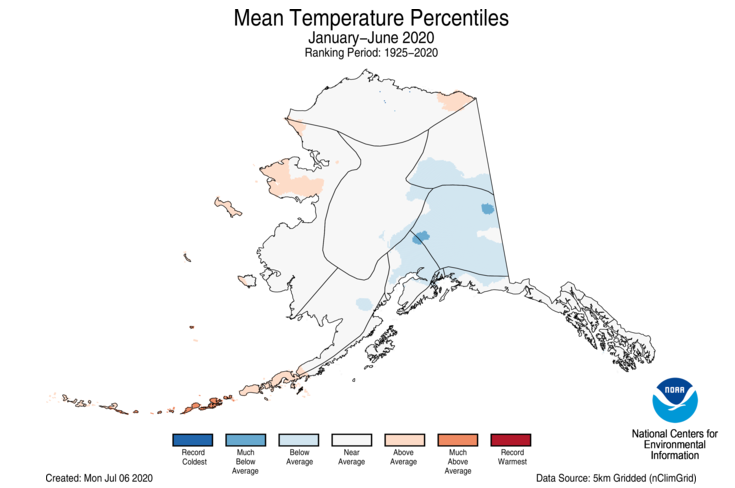
- The Alaska average June temperature was 50.5°F, 1.3°F above the long-term mean and ranked in the warmest third of the historical record for the state. Overall, western Alaska was warmer than average while the southeastern part of the state was near or below average for the month.
- Sea ice melt in the Chukchi Sea was slower than average for this time of year. June sea ice extent was 92% of average, which is the highest amount for June observed since 2017 and much higher than the record low extent observed during June 2019.
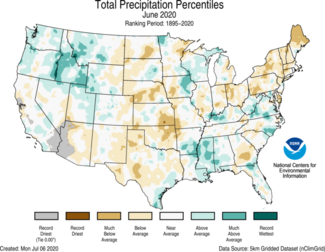
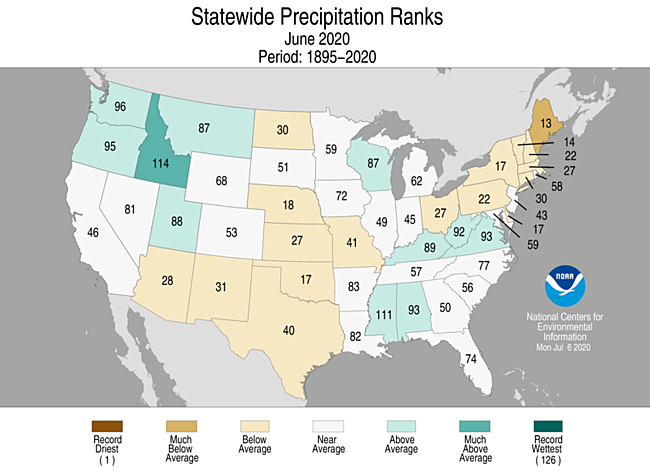
- Above-average precipitation was observed across portions of the Pacific Northwest, northern and central Rockies, Great Lakes, Deep South and the Mid-Atlantic regions. Idaho ranked 13th wettest while an additional 10 states ranked in the wettest third of their historical distribution for June.
- Below-average precipitation occurred across portions of the Southwest, Great Plains, Ohio Valley, Southeast and much of the Northeast. Maine ranked 13th driest while 16 additional states ranked in the driest third of their record for June.
- Alaska received 3.24 inches of precipitation during June, which is 0.90 inch above average and ranked seventh wettest on record. Both Juneau and Ketchikan in the Panhandle had their wettest June on record. Across the Interior, Northway, Delta Junction and Fairbanks had a top-five wettest June, while Denali National Park ranked sixth wettest.
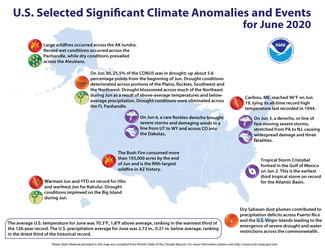
- According to the June 30 U.S. Drought Monitor report, approximately 25.5 percent of the contiguous U.S. was in drought, up from nearly 20 percent at the beginning of June. Drought conditions expanded or intensified across portions of the Plains, Rockies, Southwest, Northwest and Puerto Rico. Drought blossomed across much of the Northeast during June as a result of above-average temperatures and below-average precipitation. Drought conditions improved across parts of Hawaii and were eliminated across the Florida Panhandle.

- Above-average to record-warm January-June temperatures were observed across the vast majority of the Lower 48 states. Florida ranked warmest on record for this six-month period while New Jersey ranked third warmest and Rhode Island and Massachusetts ranked fourth warmest.
- The Alaska statewide average temperature for the year-to-date period was 21.4°F, 0.1°F below average, and ranked in the middle third of the record. Above-average temperatures were located across the Aleutians, part of the West Coast region and portions of the eastern North Slope. Below-average temperatures were concentrated across much of the Southeast Interior, Cook Inlet and southern Northeast Interior regions.
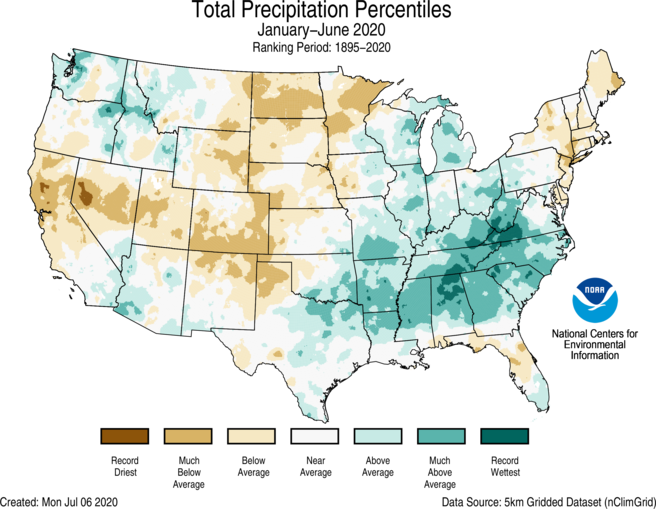
Year-to-date (January-June) Precipitation

- Above-average precipitation occurred across portions of the Northwest and Southwest and from Texas to the Great Lakes and into the Southeast. Tennessee ranked wettest on record, North Carolina ranked fourth wettest and West Virginia and Alabama ranked fifth wettest for this year-to-date period.
- Below-average precipitation was observed from the West Coast into parts of the central and southern Rockies and from the southern High Plains to the Northern Tier. Below-average conditions were also present across the Northeast and parts of Florida. North Dakota had the sixth driest and Colorado eighth driest January-June on record.
Billion-dollar Weather and Climate Disasters

- Through the end of June, 10 weather and climate disaster events have been identified, with losses exceeding $1 billion each across the U.S. during 2020. All 10 events were due to severe storms, which occurred across more than 30 states from the Great Lakes to the Gulf Coast.
- In addition to significant economic impacts, these events resulted in 80 fatalities.
- This is a record sixth consecutive year with at least 10 separate billion-dollar disasters and is at near-record pace for billion-dollar disasters during the first half of the year — 2020 is tied with 2011 and 2016, but trailing 2017 by one event.
- Since these records began in 1980, the U.S. has sustained 273 separate weather and climate disasters where overall damages/costs reached or exceeded $1 billion (based on the CPI adjustment to 2020) per event. The total cost of these 273 events exceeds $1.75 trillion.
Here is more climate and weather news from Thursday:
(As usual, this will be a fluid post in which more information gets added during the day as it crosses my radar, crediting all who have put it on-line. Items will be archived on this site for posterity. In most instances click on the pictures of each tweet to see each article. The most noteworthy items will be listed first.)
Now here are some of today’s articles and notes on the horrid COVID-19 pandemic:
(If you like these posts and my work please contribute via the PayPal widget, which has recently been added to this site. Thanks in advance for any support.)
Guy Walton “The Climate Guy”