The main purpose of this ongoing blog will be to track planetary extreme or record temperatures related to climate change. Any reports I see of ETs will be listed below the main topic of the day. I’ll refer to extreme or record temperatures as ETs (not extraterrestrials).😉
Main Topic: Early March Record Scoreboard Update And Climatological Review
It’s time once again for our monthly climatological review. Here on this site we present monthly summaries near the 7th of each month, and each is available if you want to go back through my Extreme Temperature Diary archive. This report will be added to our climate summary and record scoreboard category on this site for these posts where you can check out reviews and statistics from prior months:
https://guyonclimate.com/category/record-scoreboard-climatological-reviews/
I’m repeating my mantra from last month:
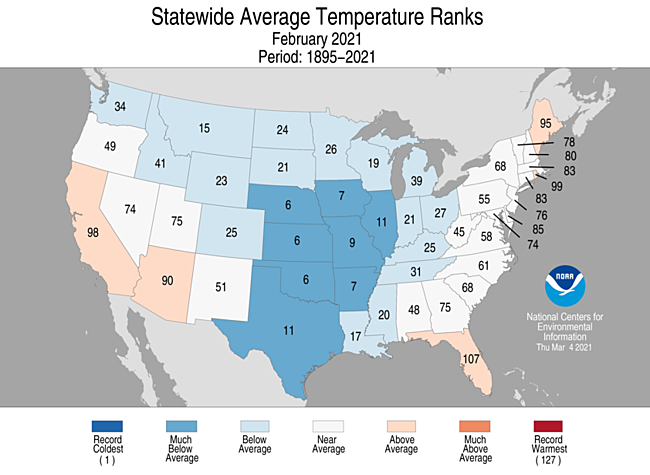
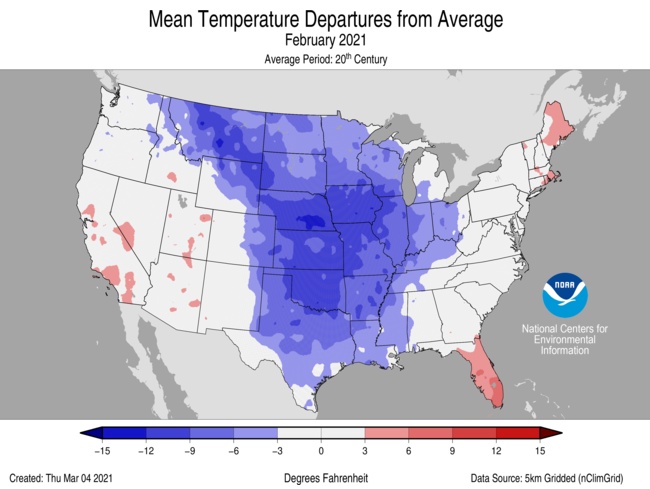
February 2021 got ranked by the National Center for Environmental Information as a well below average February, temperature wise, for the lower 48 states, coming in as the 19th coldest or 109th warmest since records began being kept in 1895:
https://www.ncdc.noaa.gov/cag/national/rankings
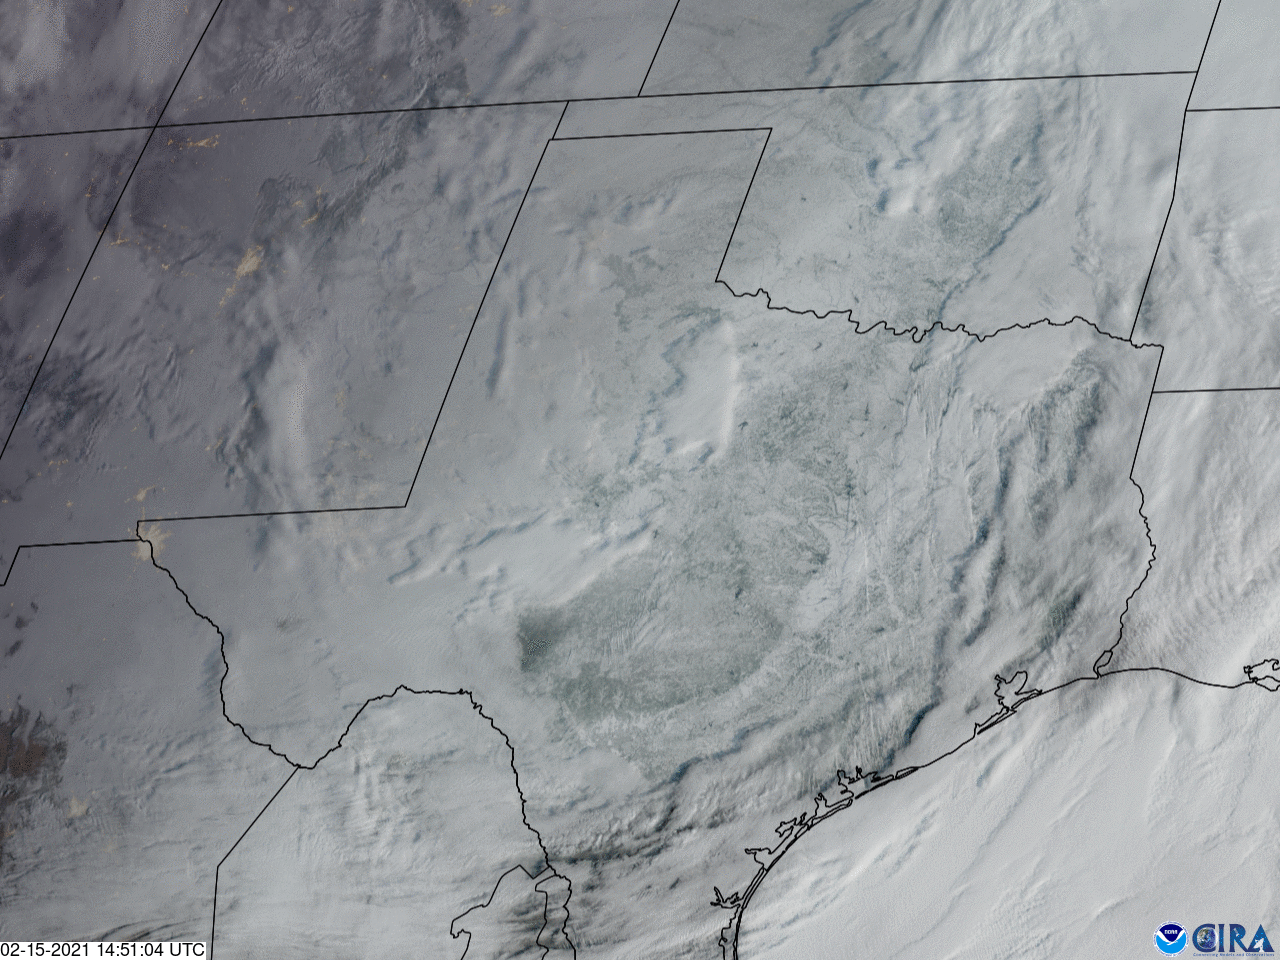
A historic cold outbreak caused misery for millions living across the south-central states. As we will see, thousands of new cold records were set mainly in the nation’s heartland southward through Texas:
Here are my two U.S. Daily Record Scoreboards updated through 3/07/2021 (data compiled from the following NCEI site):
https://www.ncdc.noaa.gov/cdo-web/datatools/records


DHMX= Daily High Max Reports. DLMN= Daily Low Min Reports. DHMN= Daily High Min Reports. DLMX=Daily Low Max Reports.
For these data sets all monthly ratios of > 10 to 1 DHMX to DLMN or > 10 to 1 DLMN to DHMX are in bold type. The rankings are for the lower 48 states with the warmest ranking since 1895 of average temperatures being 126 and 1 being the coldest as of 2021. Blue colors represent cold months and red warm. Those months and years with counts close to a 1 to 1 ratio of highs to lows are colored black. Boldly colored months, such as January 2020, have ratios of more than 10 to 1 daily record highs to lows or lows to highs, and are either historically hot or cold, most of which have made news.
February 2021 had approximately an 1-7 ratio of record DHMX to DLMN individual record counts, so the color I used for this month was blue on the top chart.
February 2021 had approximately a 1-7 ratio of record DHMN to DLMX individual record counts, so the color I used for this month was red on the bottom chart.
Due to climate change we are seeing less blue colors on these Record Scoreboards with time, but February 2021 was atypical for this trend.
February had the lowest ratio of record DHMX to DLMN since March 2014 in my database:
As stated, the ranking for February 2021 was 19, which was colored blue. I color rankings +10 or -10 from the average ranking of 63 black, indicating that these are near average temperature wise. Record statistics matched up well with the ranking of 19 for February 2021.
As shown on both charts we can see that March 2021 has gotten off to a warm start, but we are seeing indications that this month will be close to average should some forecast cold intrusions occur later in the month. This week, though, hundreds of record warm reports will get recorded ahead of a front developing in the northern Plains.
Here is much more detailed February 2021 U.S. climatology as complied by NOAA:
https://www.ncei.noaa.gov/news/national-climate-202102
Assessing the U.S. Climate in February 2021
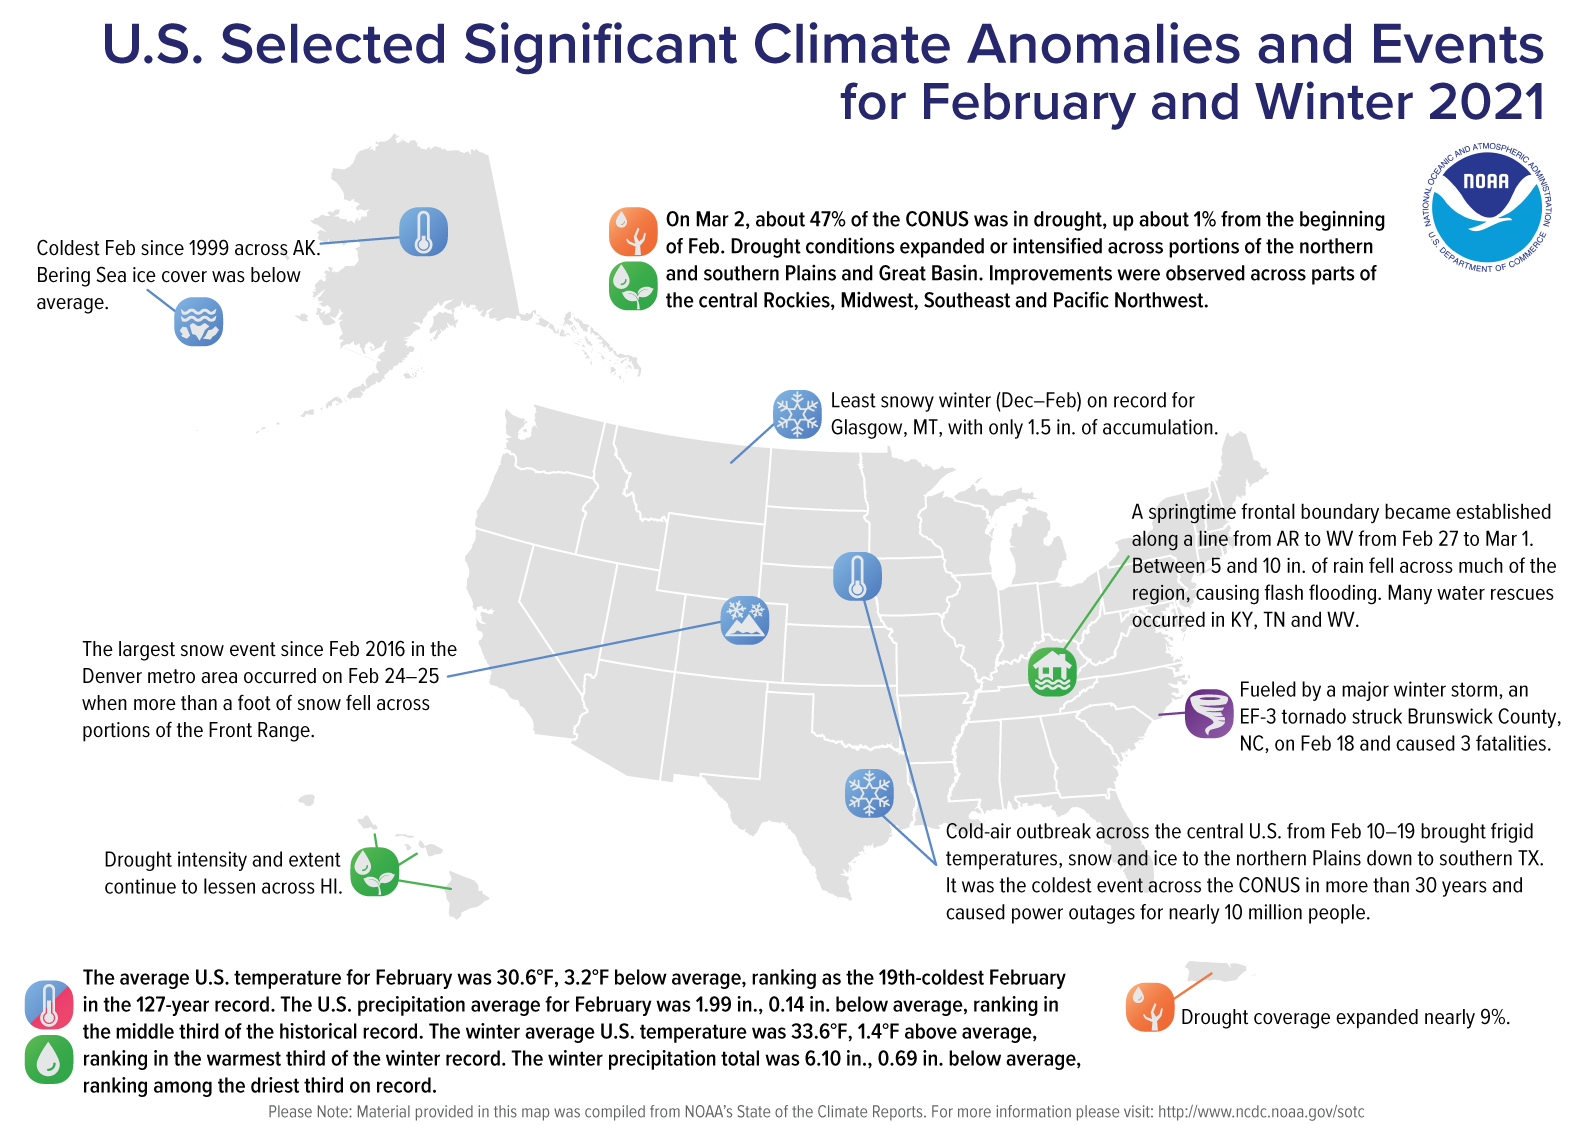
Polar vortex ushered in coldest air across central U.S. in more than 30 years; Alaska’s coldest February since 1999
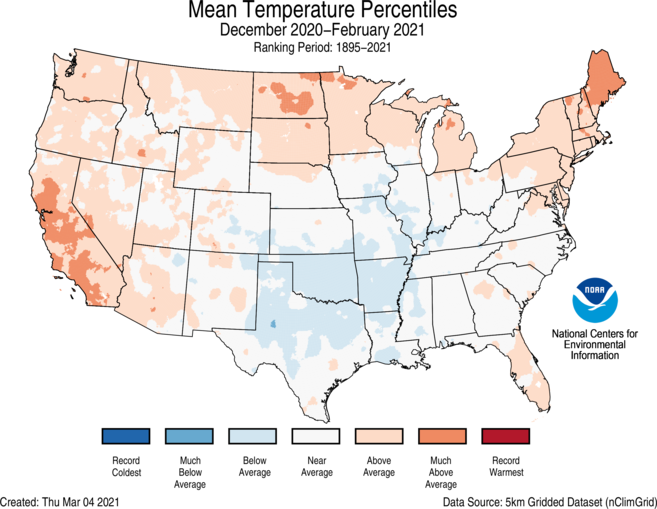
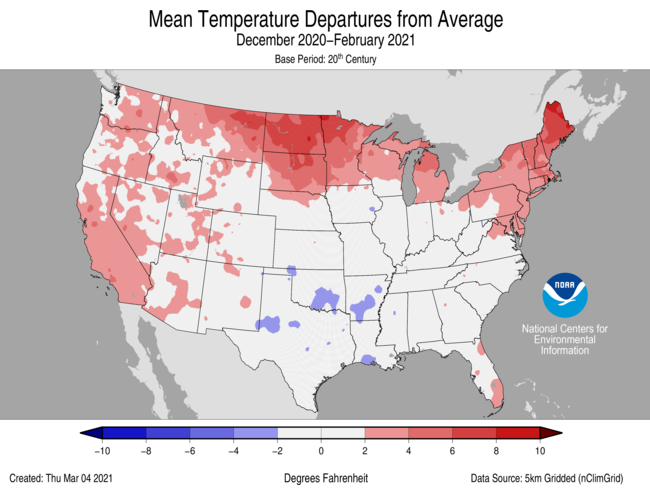
During February, the average contiguous U.S. temperature was 30.6°F, 3.2°F below the 20th-century average. This ranked as the 19th-coldest February in the 127-year period of record and was the coldest February since 1989. The winter (December-February) average contiguous U.S. temperature was 33.6°F, 1.4°F above average, ranking in the warmest third of the winter record.
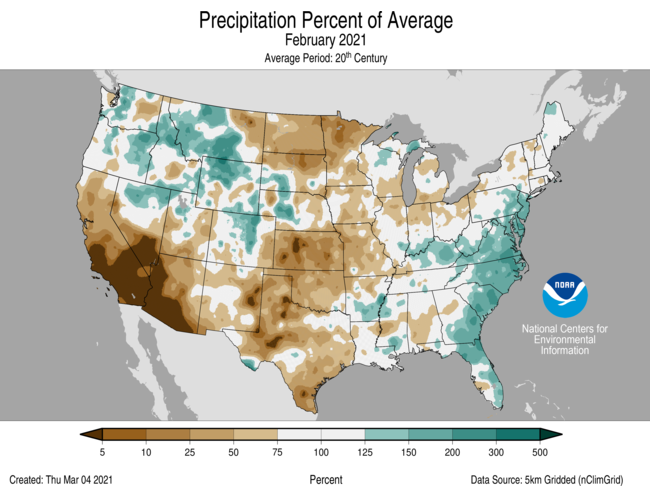
The February precipitation total for the contiguous U.S. was 1.99 inches, 0.14 inch below average and ranked in the middle one-third of the historical period of record. The winter precipitation total was 6.10 inches, 0.69 inch below average, and ranked among the driest one-third of the 126-year period of record.
This monthly summary from NOAA National Centers for Environmental Information is part of the suite of climate services NOAA provides to government, business, academia and the public to support informed decision-making.
February Temperature
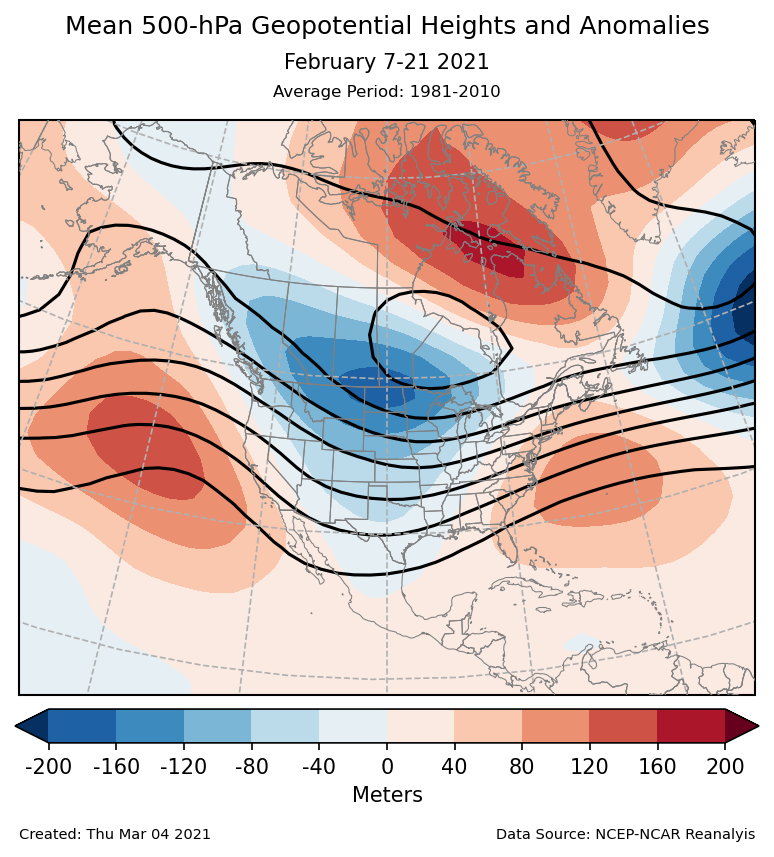
- The main driver for the weather across the contiguous U.S. during February was a strongly negative Arctic Oscillation (AO) during the first half of the month. This may have been the result of a sudden stratospheric warming event that occurred in January. The negative AO pattern favors a cold air outbreak over the central U.S., often referred to as a “polar vortex”. A blocking pattern disrupted the jet stream, which prolonged the duration of this cold event.
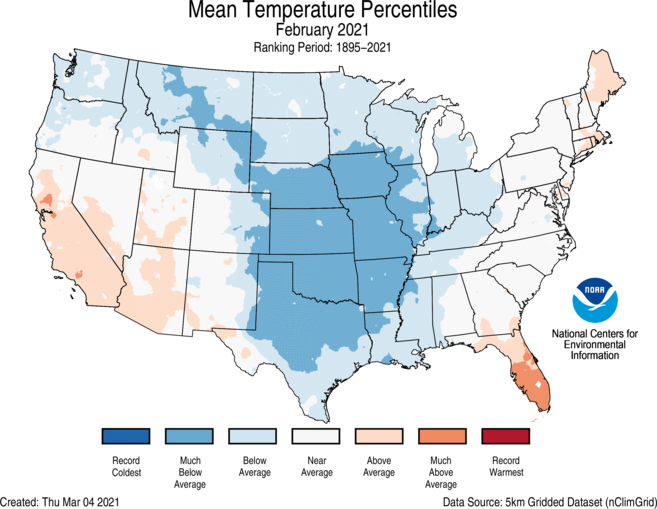
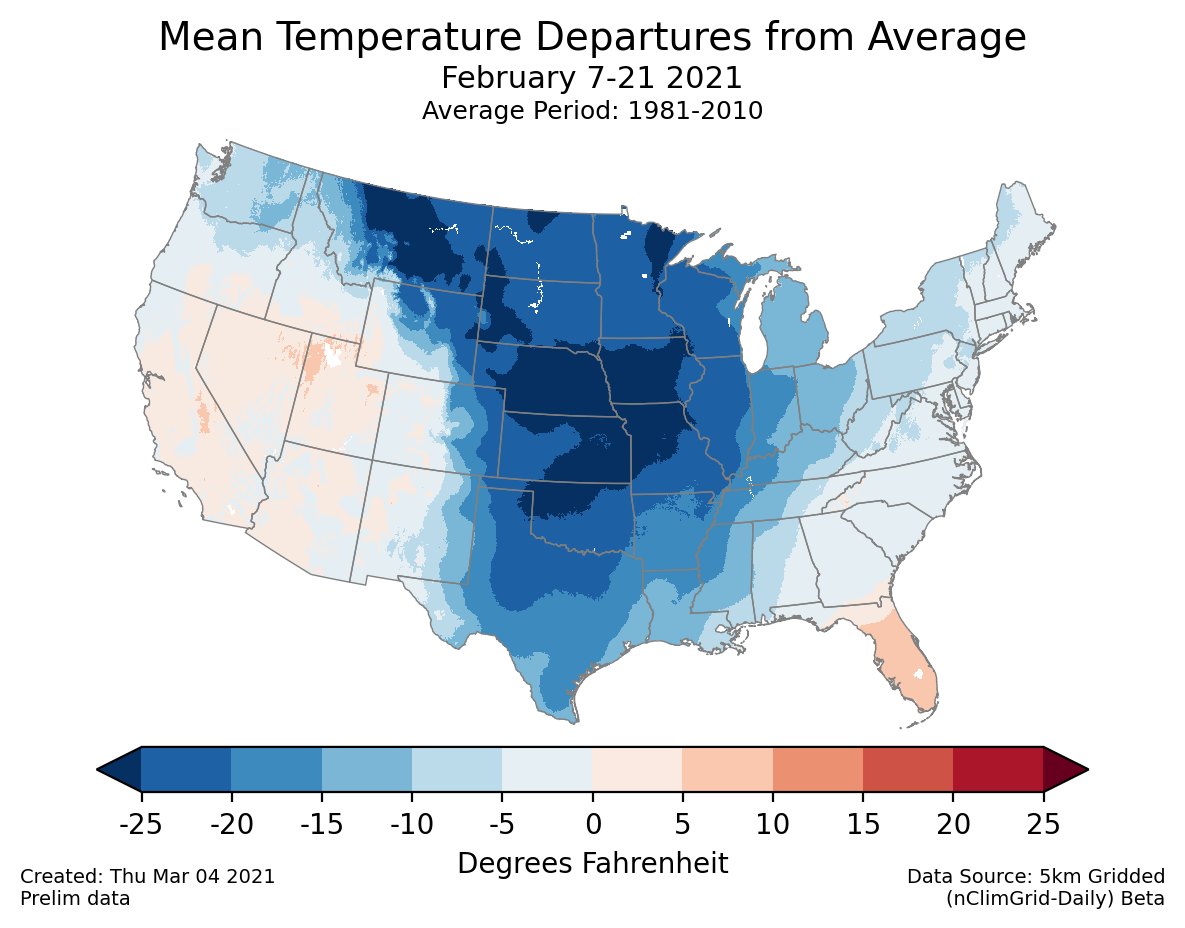
- Below-average temperatures dominated the Lower 48 and were observed from the Northwest to the Great Lakes and south to the Gulf of Mexico. Six states, Nebraska, Iowa, Kansas, Missouri, Oklahoma and Arkansas, ranked among their 10-coldest Februaries on record. Texas and Illinois ranked 11th coldest.
- From February 7-21, large areas with temperatures more than 25°F below average were evident from parts of the northern Rockies and Plains to the central Plains. A station near Ely, Minnesota, bottomed out at −50°F on February 13 and 14. Several other stations in northern Minnesota reported low temperatures in the −40°F range on February 13.
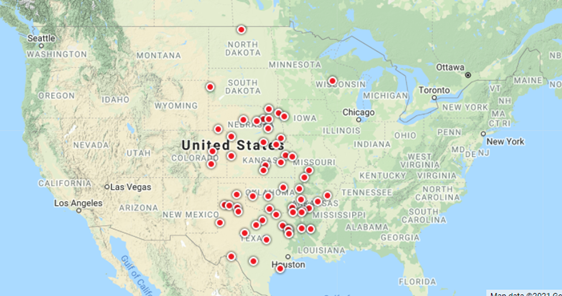
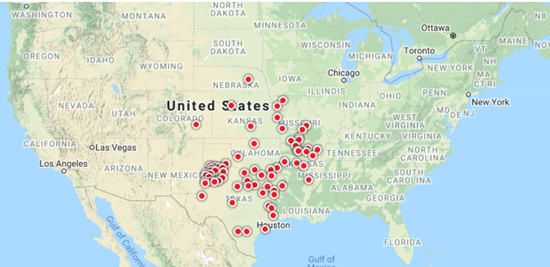
- Based on preliminary data, 62 all-time daily cold minimum temperature records were broken from February 11-16 and 69 all-time daily cold maximum temperature records on February 15-16.
- Several locations across central Texas, including Austin and Waco, broke records for the longest freezing streak with temperatures below freezing between six and nine consecutive days from February 10-19.
- Much of Texas endured the coldest air since December 23, 1989, during this period. Every county across Texas was under a Winter Storm Warning in mid-February. Wind chill values were below zero as far south as the Rio Grande River and into northeastern Mexico.
- Ice and snow cover stretched into south Texas and northeastern Mexico.
- Power outages, which were concentrated across Texas but widespread throughout much of the South, occurred over multiple days with sustained below-freezing temperatures. At the peak of the outage, nearly 10 million people were without power.
- Above-average temperatures were observed across parts of the West, Southeast and New England.
- The Alaska February temperature was 1.2°F, 3.6°F below the long-term average. This ranked among the coldest one-third of the 97-year period of record for the state and was the coldest February in 22 years.
- The northern and eastern two-thirds of the state experienced below-average temperatures in February while the southwestern portion of the state, including the Aleutians, had temperatures near or above average for the month.
- Cold Bay ranked third warmest for February, and St. Paul was fourth warmest.
- The monthly high temperature for Anchorage reached a mere 30°F, making February 2021 the first month since December 1998 with all daily high temperatures remaining below freezing.
- Bering Sea ice extent in February was below average, resulting from persistent easterly winds and above-average sea-surface temperatures to the south.
February Precipitation
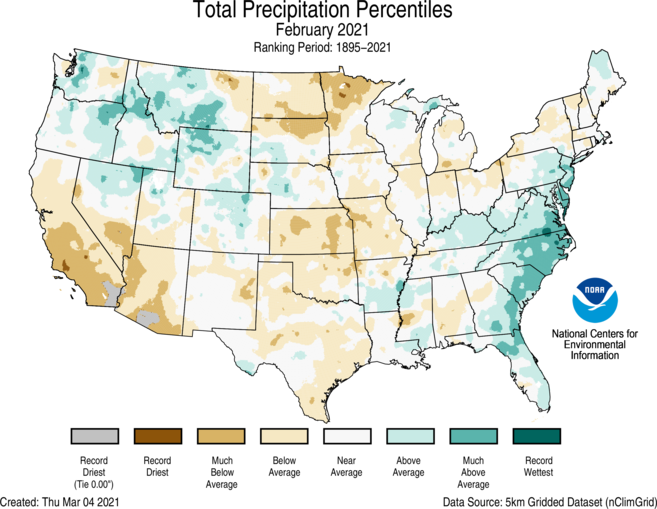
- Above-average wetness was present across much of the Northwest and portions of the East Coast and Ohio Valley. North Carolina ranked eighth wettest on record for the month while South Carolina ranked 10th wettest.
- Below-average precipitation was present across parts of the West, Plains, Great Lakes and Northeast. Kansas ranked 11th driest for February while Minnesota and North Dakota ranked 12th driest.
- From January 30-February 3, a powerful nor’easter moved up the Northeast coast and generated between 20 and 30 inches of snowfall across portions of eastern Pennsylvania, northern New Jersey and southern New York, breaking many daily snowfall records across the region. This storm was classified as a Category 3 on the Northeast Snowfall Impact Scale (NESIS) and was the biggest snowstorm in five years across much of the greater New York City metropolitan area.
- Contiguous U.S. snow cover reached 73.2 percent on February 16 — the highest daily value in the historical record since October 2003. Snow blanketed the Sierra Nevada and much of the mountainous West. In addition, snow covered an area from northeastern Mexico and nearly all of Texas to the Great Lakes and east to the mid-Tennessee Valley and across the Northeast. This was also the highest daily snow cover value observed across the contiguous U.S. since 70.9 percent of the country was blanketed in snow on January 12, 2011.
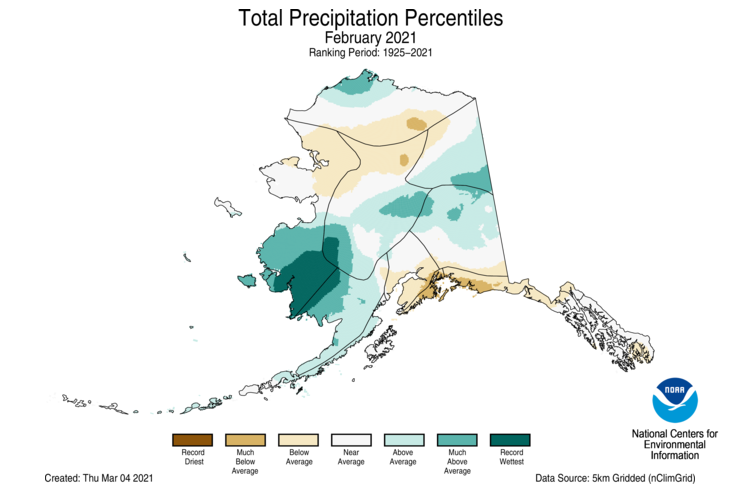
- Precipitation across Alaska varied regionally, with record-wet conditions across portions of the West Coast and Bristol Bay. Above-average precipitation was also observed across portions of the central Interior regions, North Slope and the Aleutians. Below-average precipitation occurred across parts of the northern Interior and Gulf regions.
- According to the March 2 U.S. Drought Monitor report, 46.6 percent of the contiguous U.S. was in drought, up from 45.8 percent at the beginning of February. Drought conditions expanded or intensified across portions of the northern and southern Plains, Great Basin and Puerto Rico. Improvements were observed across parts of the central Rockies, Midwest, Southeast, Pacific Northwest and Hawaii.
Winter (December-February) Temperature

- Winter temperatures were above average across much of the West, Northern Tier, Northeast and parts of the Southeast. Maine ranked third warmest, and California ranked 12th warmest for this three-month period.
- Below-average temperatures were present across parts of the Midwest, lower Mississippi Valley and the southern Plains.
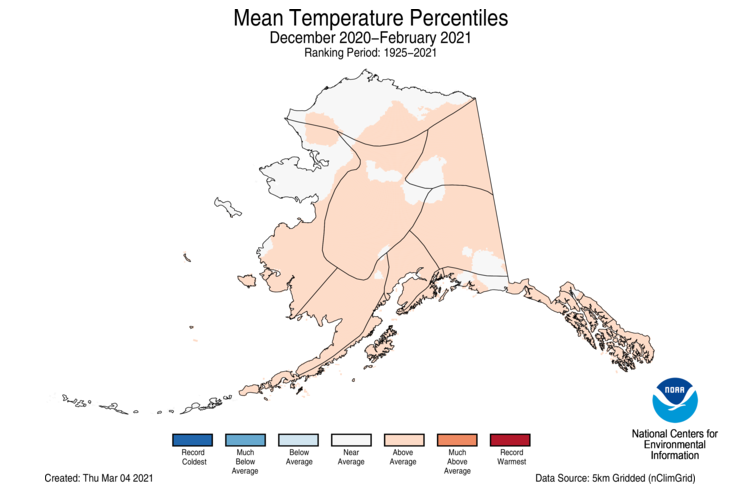
- The Alaska December-February temperature was 7.6°F, 4.0°F above the long-term average, ranking among the warmest one-third of the 96-year record. Above-average temperatures were observed across most of the state with pockets of near-average warmth across the North Slope, West Coast, central Interior and central Gulf Coast.
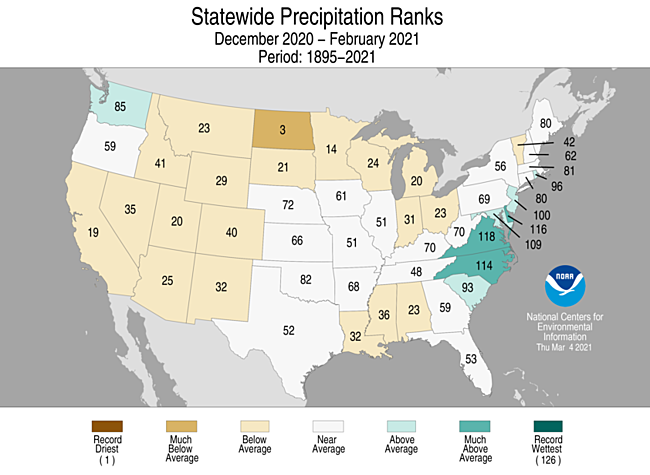
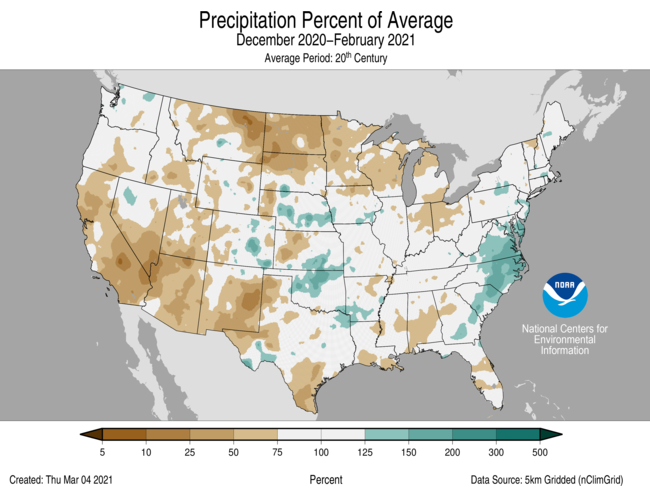
Winter (December-February) Precipitation
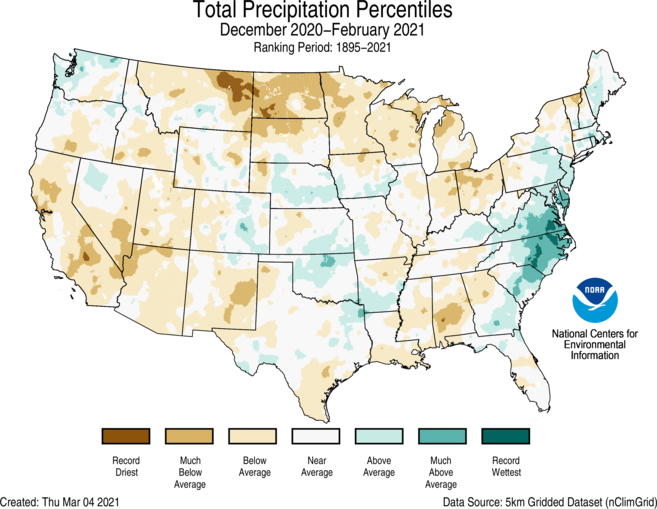
- Above-average precipitation was observed across parts of the Northwest, central Plains and East Coast. Virginia ranked ninth wettest while Delaware ranked 11th wettest for December-February.
- Many states from the West Coast to the Great Lakes and across the Gulf Coast experienced a dry winter season. North Dakota ranked third driest on record.
- For some parts of the country, snowfall was scarce during the winter months. Many locations across the northern Plains have seen a dearth of snowfall throughout the cold season and since the beginning of December. Glasgow, Montana, had its least snowy winter on record with 1.5 inches of snow observed since December 1. This eclipses the previous least snowy winter of 3.4 inches set in 1986-87. Records for Glasgow began in 1948.
- Climatologically speaking, winter is the wet season across much of the western U.S. If dry conditions continue in March and April across the Sierra Nevada range and much of the Southwest and central Rockies, insufficient water resources may occur through the dry season (summer) as well as an increased potential for drought intensification and wildfires this fall.
- While parts of the interior regions of Alaska experienced below-average winter precipitation, portions of the North Slope, West Coast, Bristol Bay, Northwest Gulf and the Panhandle regions had above-average- to record-wet conditions.
See all February U.S. temperature and precipitation maps.
Here is some other February 2021 climatology:
Here is more climate and weather news from Monday:
(As usual, this will be a fluid post in which more information gets added during the day as it crosses my radar, crediting all who have put it on-line. Items will be archived on this site for posterity. In most instances click on the pictures of each tweet to see each article. The most noteworthy items will be listed first.)
Now here are some of today’s articles and notes on the horrid COVID-19 pandemic:
(If you like these posts and my work please contribute via the PayPal widget, which has recently been added to this site. Thanks in advance for any support.)
Guy Walton “The Climate Guy”