The main purpose of this ongoing blog will be to track planetary extreme, or record temperatures related to climate change. Any reports I see of ETs will be listed below the main topic of the day. I’ll refer to extreme or record temperatures as ETs (not extraterrestrials).😉
Main Topic: U.S. November Record Scoreboard and Climatological Review
Dear Diary. It’s time once again for our monthly climatological review. Here on this site, we present monthly summaries near the 8th of each month, and each is available by clicking the link below:
https://guyonclimate.com/category/record-scoreboard-climatological-reviews/
I’m repeating this mantra every month:
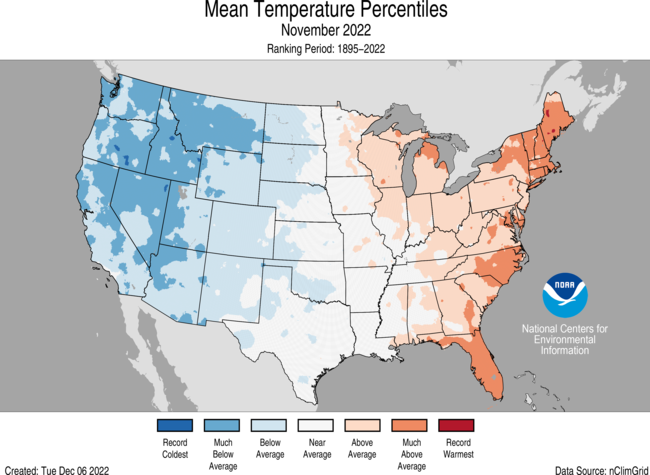
November 2022 using 1901-2000 mean data got ranked by the National Center for Environmental Information for the lower 48 states as 85th warmest, or 44th coolest since records began being kept in 1895:
https://www.ncdc.noaa.gov/cag/national/rankings
The lower 48 states finally had a colder than average month. Due to our ongoing drought, cold, snowy weather was welcome in the West while above average conditions occurred in the East. It was the coldest November in nearly four decades in portions of the West. This weather pattern is continuing into December.

Brief summary for November 2022: Most reports of record heat came from the northern tier of states early in the month. A cold shot of air produced most record chill during mid-November mainly across the West and Midwest.
Here are my two U.S. Daily Record Scoreboards updated through 11/08/2022 (data compiled from the following NCEI site):
https://www.ncdc.noaa.gov/cdo-web/datatools/records


DHMX= Daily High Max Reports. DLMN= Daily Low Min Reports. DHMN= Daily High Min Reports. DLMX=Daily Low Max Reports.
Bold red-, blue- or purple-colored months, such as January 2020 and June 2021, that have ratios of >10 to 1 daily warm low records or <1 to 10 daily warm to low records are either historically hot or cold, most of which have made news. NCEI rankings are for the lower 48 states with the warmest ranking since 1895 of average temperatures being 127 (for ties) or 128 and 1 being the coldest as of 2022. Blue colors represent cold months and red warm. Those months and years with counts close to a 1 to 1 ratio of highs to lows are colored black. All-time record hottest or coldest months and years are boldly colored in purple. NCDC rankings have been color coded (under tabs in each file) such that values of 54 to 74 are black representing neutral months or years (+ or – 10 from the average ranking of 64).
Record numbers statistically matched up well during November of 2022 with that month being the 44th coldest November on record.
November 2022 had approximately a 22 to 23 ratio of record DHMX to DLMN individual record counts, so the color I used for this month was black on the top chart.
November 2022 had approximately a 20 to 27 ratio of record DHMN to DLMX individual record counts, so the color I used for this month was blue on the bottom chart.
Due to climate change, we are seeing fewer blue colors on these Record Scoreboards with time, but November 2022 was an exception to this trend.
As stated, the ranking for November 2022 was 44, which was colored blue since it was below average.
I color rankings of +20 or -20 from the average ranking for the lower 48 states of 64 black, indicating that these are near average temperature wise. The top warmest ranking for 2022 would be 128 since rankings began in 1895.
December 2022 has gotten off to a cold start across the West but especially warm across the Southeast. This trend will continue well into December.
**Special note: It was interesting that December 2021 was the warmest on record and that conditions across the U.S. this month are trending colder than average. A lot of times I’ve noticed that if there is a big spike in temperatures one way or the other on climatological charts, the following year a near opposite spike will occur…all while an upward trend overall in the long term occurs because of climate change. Nature tries to balance systems out via the old for every action there is the opposite reaction adage.**
Here is much more detailed climatology for November 2022 as complied by NOAA:
Assessing the U.S. Climate in November 2022
Abnormally dry conditions cover nearly 80% of the Lower 48; coldest November across parts of the Pacific Northwest in nearly four decades

Key Points:
- The average temperature of the contiguous U.S. in November 2022 was 41.0°F, which is 0.7°F below average, ranking in the middle third of the record. Generally, temperatures were above average from the Midwest to the Northeast and Southeast, and below average from the Plains to the West Coast.
- November precipitation for the contiguous U.S. was 2.40 inches, 0.17 inch above average, ranking in the middle third of the historical record. Precipitation was above average from the Great Lakes to the southern Plains, from the Gulf Coast to the Northeast and across portions of the Great Basin, northern Rockies and northern Plains. Precipitation was below average across southern Michigan to the Ohio Valley and in the central Plains.
- Parts of the Pacific Northwest had their coldest November in nearly four decades. Washington State observed its coldest November since 1985. Oregon saw its coldest November since 1994 and Idaho had its coldest November since 2000.
- Hurricane Nicole became the first hurricane in nearly 40 years to make landfall in the United States in November. According to the November 29 U.S. Drought Monitor report, about 57.5% of the contiguous United States was in drought. Severe to exceptional drought was widespread from the Great Basin to the Pacific Coast, across much of the Great Plains to Mississippi Valley, and in parts of Hawaii, with moderate to severe drought in parts of the Southeast and Northeast.

Other Highlights:
Temperature

For the month of November, Maine ranked fifth warmest on record while Florida ranked seventh warmest, with five additional states experiencing a top-10 warmest November on record. Conversely, temperatures were below average to record coldest across much of the West. Idaho ranked fourth coldest, Washington ranked sixth and Oregon ranked seventh, while two additional states each had their top-10 coldest November on record.
The meteorological autumn (September-November) average temperature for the Lower 48 was 54.7°F, 1.2°F above average, ranking in the warmest third of the record. Temperatures were above average from the West Coast to the Great Lakes and into the Northeast as well as along portions of the East Coast. Temperatures were near- or below-normal in parts of the Southwest, the southern Plains, and from the southern and central Mississippi Valley to the Ohio Valley and Southeast. Maine ranked fourth warmest while five additional states ranked among their warmest 10 autumn seasons on record.
For the January-November period, the average contiguous U.S. temperature was 55.2°F, 1.5°F above average, ranking 17th warmest in the 128-year record. Temperatures were above average from the West Coast to the Gulf Coast and from the Gulf to New England. California and Florida each ranked fifth warmest while Massachusetts and Rhode Island each had their sixth warmest January-November period on record. Five other states ranked among their warmest 10 year-to-date periods on record. Temperatures were near average from the northern Plains and Upper Midwest to the Tennessee Valley.

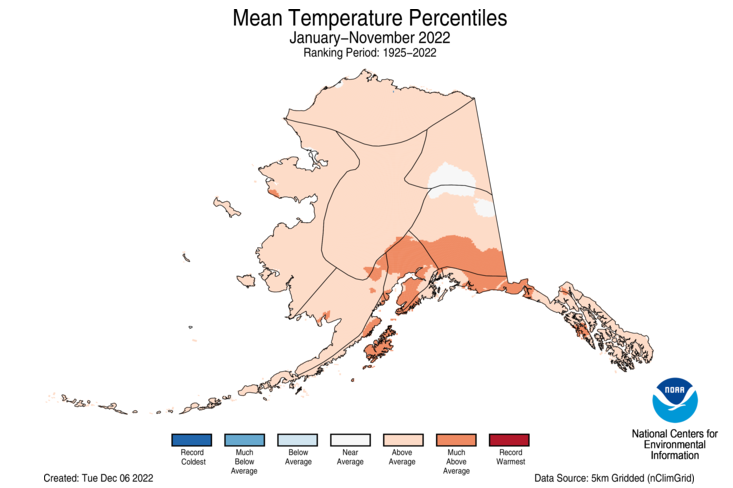
The Alaska statewide November temperature was 16.3°F, 4.6°F above the long-term average. This ranked in the warmest third of the 98-year period of record for the state. Temperatures were above average across much of northern Alaska, the Yukon Delta, the Aleutians and parts of the eastern Interior. South central Alaska and areas along the Gulf of Alaska to the Panhandle experienced near-average conditions, while the southern Panhandle experienced below-average temperatures for the month.
The Alaska autumn temperature was 29.2°F, 3.3°F above the long-term average, ranking 18th warmest on record for the state. Temperatures were above average across most of the state with the central Interior region near average for the season.
The Alaska January-November temperature was 30.7°F, 2.7°F above the long-term average, ranking 15th warmest on record for the state. Above-average temperatures were observed across the vast majority of the state for this 11-month period.
Precipitation

November precipitation was near- to above-average over much of the contiguous U.S. Precipitation was below average in parts of the Southwest, central Plains, Ohio Valley and Great Lakes. No state experienced a top-10 wettest or driest November.
The U.S. autumn precipitation total was 5.92 inches, 0.96 inch below average, ranking in the driest third portion of the September-November record. Precipitation was above average across parts of the Rockies, Southwest and East Coast. Precipitation during September-November was below average along the West Coast and from the northern and central Plains to the Great Lakes and Ohio River Valley. Nebraska ranked fifth driest while four additional states experienced a top-10 driest autumn season on record.
The January-November precipitation total for the contiguous U.S. was 25.61 inches, 1.98 inches below average, ranking in the driest third of the historical record. Precipitation was above average across portions of the Northeast, Great Lakes, Ohio Valley, southern Mississippi Valley, and in parts of the Rockies and Northwest. Precipitation was below average across much of the West, central and southern Plains and parts of the East Coast during the January-November period. California ranked second-driest on record while Nebraska ranked fourth driest and Nevada ranked 11th driest for this 11-month period.
Monthly precipitation averaged across the state of Alaska was 3.37 inches, 0.02 inches below average, ranking in the middle third of the 98-year record. Conditions were wetter than average across the North Slope, central Interior, West Coast and in portions of the Aleutians while much of eastern Alaska and northern parts of the Panhandle experienced near-average conditions. Southern areas of the Panhandle had below-average precipitation for the month.
For the autumn season, precipitation ranked 12th wettest across Alaska with wetter-than-average conditions observed across most of the state. Parts of the central Interior, Aleutians and southern Panhandle experienced near average precipitation for this period.
The January-November precipitation ranked second-wettest on record for Alaska, with above-average to record high precipitation observed across much of the state. The central and northeast Interior regions were near-average while much of the Aleutians experienced below-average precipitation for this period.
Other Notable Events
November had several notable storms that brought severe thunderstorms and tornadoes to portions of the United States:
- On November 4-5, a tornado outbreak occurred across portions of Texas, Oklahoma, Louisiana and Arkansas. A total of 31 tornadoes were confirmed by the National Weather Service, including two EF-4 tornadoes, which brought significant damage to the region including mass power outages.
- On November 29-30, severe storms and tornadoes swept through parts of the South, downing trees, damaging homes in parts of Alabama and Mississippi. The National Weather Service confirmed 11 tornadoes during this outbreak including two EF-3 tornadoes.
On November 10, Hurricane Nicole made landfall along Florida’s eastern shore, flooding the coast and knocking out power to thousands. Nicole was the first hurricane to hit the United States in November in nearly 40 years.
On November 7-10, a winter storm brought heavy snow and strong winds across much of the West. Parts of Washington, California, Montana and North Dakota reported between one to three feet of snow.
A historic snowstorm slammed western and northern New York on November 16-20 with more than six feet of snow reported in some areas, closing roads, triggering driving bans and canceling flights. The city of Buffalo set a record for daily snowfall, with 21.5 inches on Saturday, November 19. The previous record was 7.6 inches. The State Climate Extremes Committee is investigating whether or not a new New York state 24-hour snowfall record has been set.
Drought

According to the November 29 U.S. Drought Monitor report, about 57.5% of the contiguous U.S. was in drought, down about 5.3% from the beginning of November. Drought conditions expanded or intensified across portions of the Southeast, Great Lakes, Upper Midwest and central Plains. Drought contracted or was eliminated across portions of the Northwest, northern and southern Plains, Mississippi Valley and parts of the Northeast and Hawaii.
According to the One-Month Outlook issued on December 1 from the National Interagency Fire Center, the contiguous U.S. and Alaska are expected to be near normal while the islands of Hawaii have above normal significant wildland fire potential during December.
This monthly summary from NOAA National Centers for Environmental Information is part of the suite of climate services NOAA provides to government, business, academia and the public to support informed decision-making. For more detailed climate information, check out our comprehensive November 2022 U.S. Climate Report scheduled for release on December 13, 2022.
Here are some “ET’s” recorded from around the planet the last couple of days, their consequences, and some extreme temperature outlooks:
Here is some other global November 2022 climatology:
Here is more climate and weather news from Wednesday:
(As usual, this will be a fluid post in which more information gets added during the day as it crosses my radar, crediting all who have put it on-line. Items will be archived on this site for posterity. In most instances click on the pictures of each tweet to see each article. The most noteworthy items will be listed first.)
If you like these posts and my work please contribute via the PayPal widget, which has recently been added to this site. Thanks in advance for any support.)
Guy Walton… “The Climate Guy”