Dear Diary. At the end of every year that I live I’ll be gleaning National Center for Environmental Information global record counts for scientific purposes. It remains unfortunate that their system does not archive this data much like it does for that of individual countries. Once a new year arrives, poof, the prior year’s tallies are gone unless an army of statisticians were to add record reports from over one hundred countries:
This will be my third consecutive year for this exercise. As a reminder, I started this business for climate science on 1/1/2000, which led to this first study:
The main purpose in doing this is to glean global totals to compare to global averages and anomalies, although national totals are very interesting.
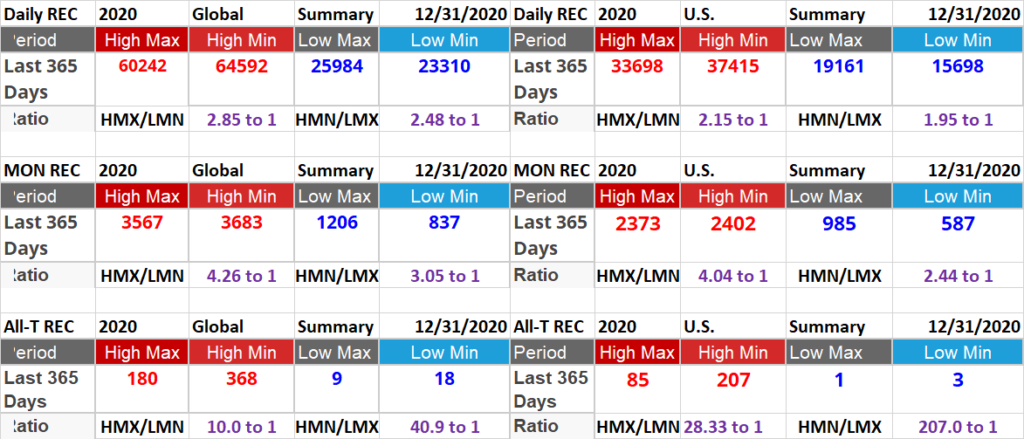
Here are totals from 2020:
Last year I intended to get totals on 12/31/2021 to get the best figures for 2021, but the system went down for maintenance before I could do so. Also, once the system came back online on 1/03/2022, I noticed that no further updates came in after 12/27/2021. What we are left with are the best stats for 2021 given the fact that, poof-now they are gone, global totals are not archived by month and year like those for individual countries, such as the United States.
Here is what we see comparing apples to apples from the same 365-day period from 1/3/2021-1/3/2022:

So, here is what we have at the end of 2022 for this yearly totals. (Updated on 12/31/22):
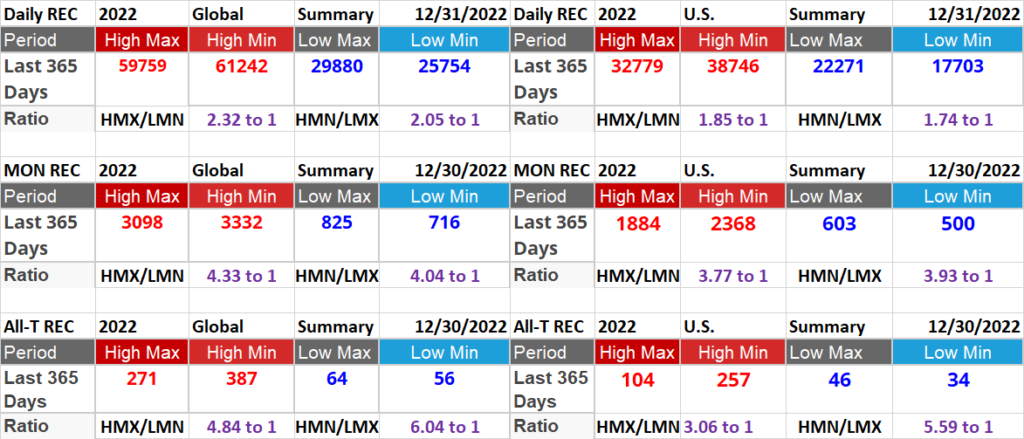
Here are some important things we can glean from this data for the 2020s, so far:
1. Record chill continues to lag record heat by large margins.
2. Record high minimum tallies are greater than those for high maximums, demonstrating that nights are warming faster than days.
3. For some unknown reason, U.S. warmth continues to lag behind global warmth as a whole looking at ratios.
Keeping in mind that global average temperatures for 2022 were roughly +1.2°C above preindustrial conditions, we see that the ratio of global daily high max to low min records (including ties) was about 2.32 to 1, which was lower than the 2.83 to 1 ratio for 2021. Despite the lower ratio, all of this added heat from carbon pollution caused extreme weather havoc during 2022, including historic European and Asian heat waves and droughts.
We will see what transpires during 2023, but I fear that we will see more of the same.
Here are some “ET’s” recorded from around the planet the last couple of days, their consequences, and some extreme temperature outlooks, as well as some extreme precipitation reports:
Here is some December 2022 climatology:
Here is more climate and weather news from Friday:
(As usual, this will be a fluid post in which more information gets added during the day as it crosses my radar, crediting all who have put it on-line. Items will be archived on this site for posterity. In most instances click on the pictures of each tweet to see each article. The most noteworthy items will be listed first.)
If you like these posts and my work please contribute via the PayPal widget, which has recently been added to this site. Thanks in advance for any support.)
Guy Walton… “The Climate Guy”
3 thoughts on “Extreme Temperature Diary- Friday December 30th, 2022/ Main Topic: NCEI Global and National Record Count and Ratio Summaries at the End Of 2022”