The main purpose of this ongoing blog will be to track planetary extreme, or record temperatures related to climate change. Any reports I see of ETs will be listed below the main topic of the day. I’ll refer to extreme or record temperatures as ETs (not extraterrestrials).😉
Main Topic: U.S. February Record Scoreboard and Climatological Review
Dear Diary. It’s time once again for our monthly climatological review. Here on this site, we usually present monthly summaries near the 8th of each month, and each is available by clicking the link below:
https://guyonclimate.com/category/record-scoreboard-climatological-reviews/
I’m repeating this mantra every month:
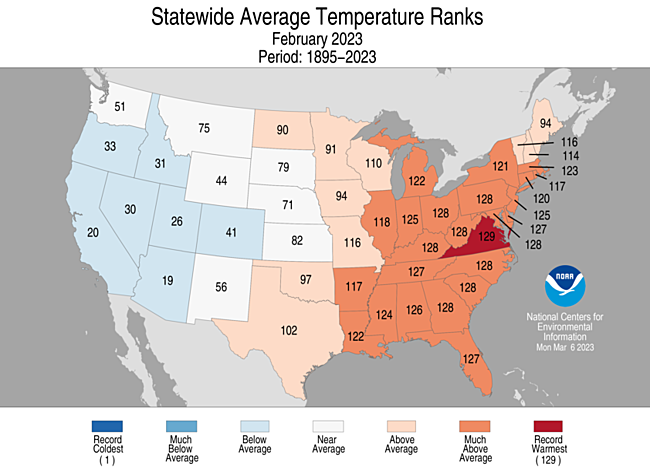
February 2023 using 1901-2000 mean data got ranked by the National Center for Environmental Information for the lower 48 states as 28th warmest, or 102nd coolest since records began being kept in 1895.
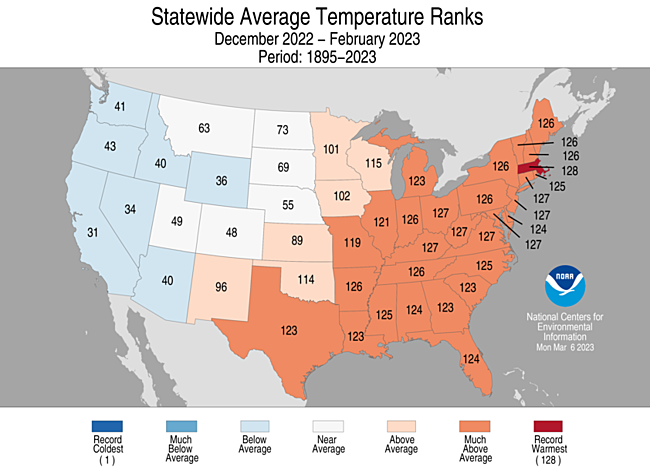
As a whole using 1901-2000 mean data the winter of 2022/23 data got ranked by the National Center for Environmental Information for the lower 48 states as 17th warmest, or 112th coolest since records began being kept in 1895:
https://www.ncdc.noaa.gov/cag/national/rankings
I recently wrote a post entitled “Winter Disappeared for Many Across the U.S. and Europe.” Indeed, residents of the Northeast were scratching their heads about the lack of snow and cold times. During February all of the East had an extremely warm February while the West was shivering. Virginia had its warmest February in state history:
The same held true for Winter 2022/23 with Massachusetts holding top honors for anomalous warmth. While cold, the West did not see a top 20 coldest winter:
Brief summary for February 2023: Most reports of record warmth came from the East and South throughout the month. Most reports of record chill came from the West during the entire period. It was cold enough to produce 9 reports of all-time record low mins and low maxes.
Here are my two U.S. Daily Record Scoreboards updated through 3/8/2023 (data compiled from the following NCEI site):
https://www.ncdc.noaa.gov/cdo-web/datatools/records
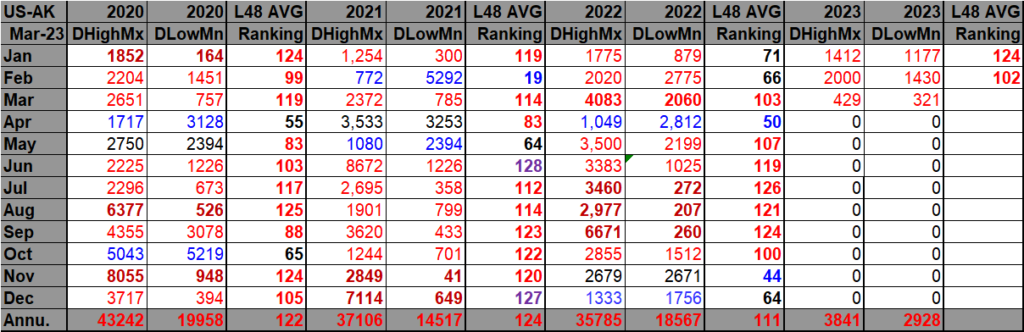
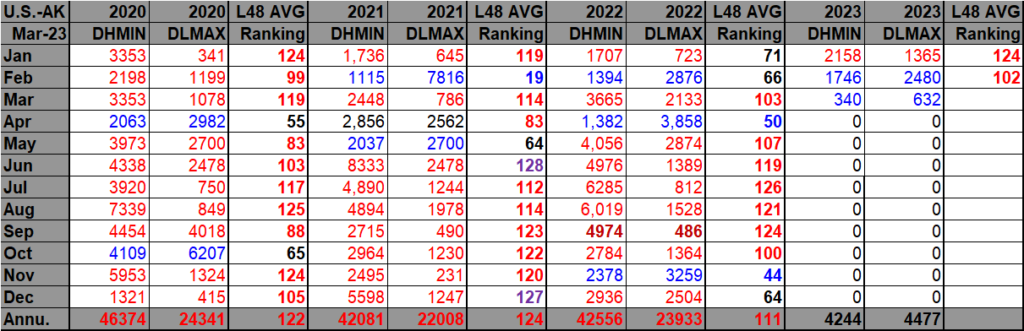
DHMX= Daily High Max Reports. DLMN= Daily Low Min Reports. DHMN= Daily High Min Reports. DLMX=Daily Low Max Reports.
Bold red, blue, or purple colored months, such as January 2020 and June 2021, that have ratios of >10 to 1 daily warm low records or <1 to 10 daily warm to low records are either historically hot or cold, most of which have made news. NCEI rankings are for the lower 48 states with the warmest ranking since 1895 of average temperatures being 128 (for ties) or 129 and 1 being the coldest as of 2023. Blue colors represent cold months and red warm. Those months and years with counts close to a 1 to 1 ratio of highs to lows are colored black. All-time record hottest or coldest months and years are boldly colored in purple. NCDC rankings have been color coded (under tabs in each file) such that values of 54 to 74 are black representing neutral months or years (+ or – 10 from the average ranking of 64).
I have come up with new programmed files such that daily record counts for Alaska are subtracted from NCEI values for the United States as a whole. This will enable us to better compare apples to apples values for the lower 48 states and NCEI average temperature rankings for the lower 48 states since 1895. These new files should be better, but they aren’t perfect since Hawaii and other U.S. tallies from all territories are still included in total counts. However, since the bulk of reporting stations outside of the lower 48 do come from Alaska, this is a good first fix. From what I can tell so far, differences between ratios of total U.S. tallies and those minus Alaska are minor.
Record numbers statistically matched up well during February of 2023 with that month being the 28th warmest February on record, but I’m a little surprised at how many daily record low maxes were reported from the West…many more than the record high minimums reported from the East.
February 2023 had approximately a 10 to 7 ratio of record DHMX to DLMN individual record counts, so the color I used for this month was blue on the top chart.
February 2023 had approximately a 17 to 25 ratio of record DHMN to DLMX individual record counts, so the color I used for this month was blue on the bottom chart.
Due to climate change, we are seeing fewer blue colors on these Record Scoreboards with time, and February 2023 added to this trend.
As stated, the average temperature lower 48 state ranking for February 2023 was 102, which was colored red since it was above average.
I color rankings of +10 to -10 from the average ranking for the lower 48 states of 64 black, indicating that these are near average temperature wise. The top warmest ranking for 2023 would be 129 since rankings began in 1895.
We are seeing that March 2023 has gotten off to the same pattern from the winter with record warmth being reported in the South and East while record chill continues in the West. A pattern change will chill the East starting the second week of the month.
Here is much more detailed climatology for Winter 2022/23 and February 2023 as complied by NOAA:
Assessing the U.S. Climate in February 2023
Parade of Pacific storms cut California drought footprint in half since January; much of the eastern U.S. had a record- to near record-warm January-February period

PUBLISHED
MARCH 8, 2023
Related Links
February 2023 U.S. Climate Report (Available March 13, 2023)
National Temperature and Precipitation Maps
Climatological Rankings Explained
State of the Climate Summaries
Key Points:
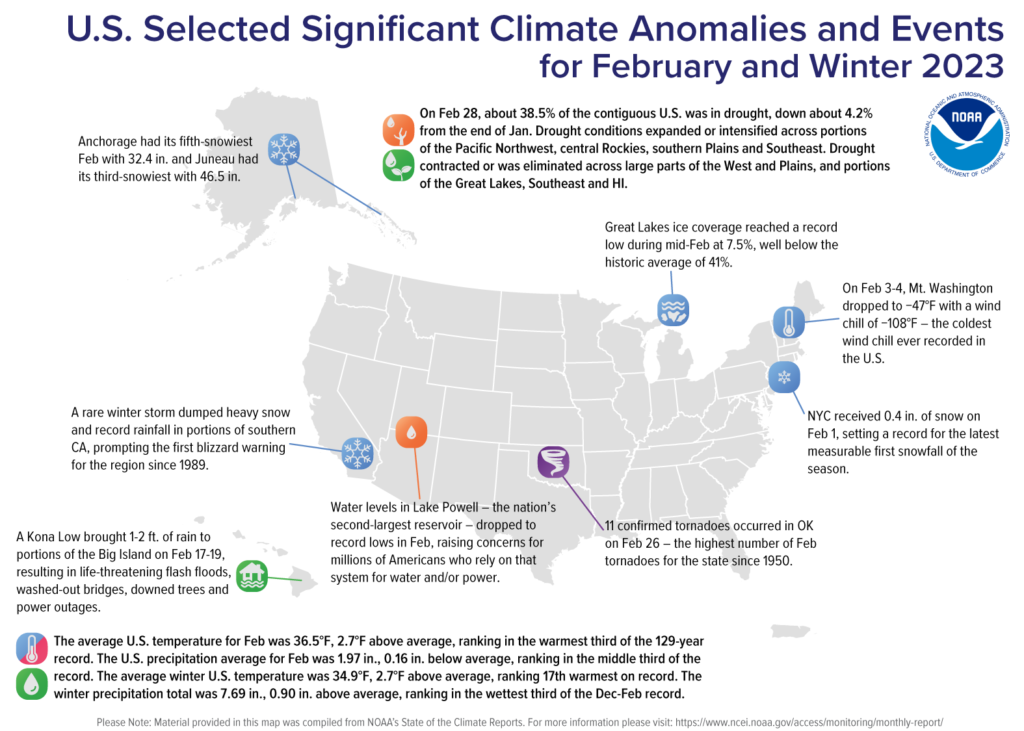
- The average temperature of the contiguous U.S. in February 2023 was 36.5°F, which is 2.7°F above average, ranking in the warmest third of the record. Virginia had its warmest February in the 129-year record.
- February precipitation for the contiguous U.S. was 1.97 inches, 0.16 inch below average, ranking in the middle third of the historical record.
- Since January, a series of storms brought record amounts of rain and snow to California improving the drought coverage from 98% on January 3 to 49% on February 28.
- Much of the eastern U.S. had a warm start to 2023. For the January-February period, 12 states were record warmest with 18 additional states experiencing a top-10 warmest event for this period.
- During early February, an Arctic air mass accompanied by powerful winds swept across portions of the Northeast, resulting in dangerously low temperatures, power outages and canceled flights.
- A Kona Low, a type of cyclone which usually forms near the Hawaiian Islands during the winter months, brought 1-2 ft. of rain to portions of the Big Island of Hawaii on Feb 17-19, resulting in life-threatening flash flooding, washed-out bridges, downed trees and power outages.According to the February 28 U.S. Drought Monitor report, about 38.5% of the contiguous United States was in drought. Moderate to exceptional drought was widespread from the Great Basin to the Pacific Coast and across much of the Great Plains, with moderate to severe drought in parts of the Great Lakes and moderate drought in parts of the Southeast.
Other Highlights:
Temperature
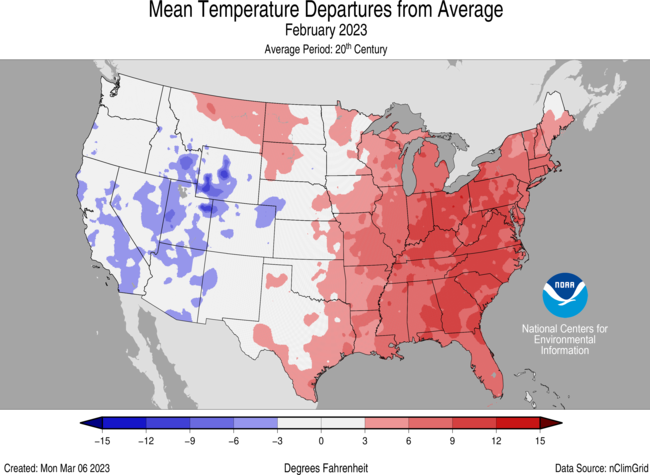
Generally, temperatures were above average across much of the eastern half of the contiguous U.S., including parts of the northern High Plains, with below-average temperatures from the central Rockies to the West Coast. Pennsylvania, Maryland, Ohio, West Virginia, Kentucky, North Carolina, South Carolina and Georgia each ranked second warmest while Delaware, Tennessee and Florida each ranked third warmest, with nine additional states experiencing a top-10 warmest February on record.
The meteorological winter (December-February) average temperature for the Lower 48 was 34.9°F, 2.7°F above average, ranking 17th warmest on record. Temperatures were above average from the southern Plains to the East Coast. Temperatures were near- or below-normal from the northern and central Plains to the West Coast. Massachusetts had its warmest winter on record. Connecticut, New Jersey, Maryland, Ohio, West Virginia, Virginia and Kentucky ranked second warmest while 21 additional states ranked among their top-10 warmest winter seasons on record.
For the January-February period, the average contiguous U.S. temperature was 35.8°F, 3.9°F above average, ranking 13th warmest in the 129-year record. Temperatures were above average across much of the conterminous U.S. with near- to below-average temperatures from the central Plains to the West Coast. New Hampshire, Massachusetts, Rhode Island, Connecticut, New York, Pennsylvania, New Jersey, Maryland, Delaware, Ohio, Kentucky and Virginia each had their warmest January-February period on record. Maine, Vermont, Indiana, West Virginia, Tennessee and North Carolina each had their second warmest while 12 additional states ranked among their warmest 10 year-to-date periods on record.
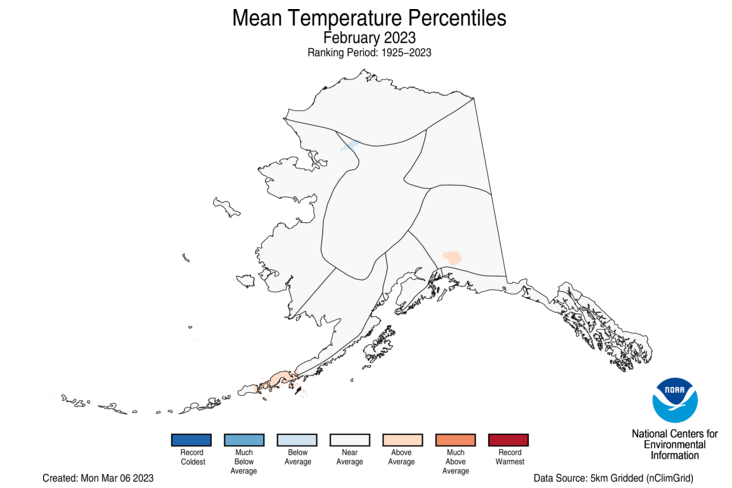
The Alaska statewide February temperature was 5.9°F, 1.1°F above the long-term average. This February was in the middle third of the 99-year period of record for the state. Temperatures were near average across almost the entire state for the month.
The Alaska winter temperature was 8.1°F, 4.5°F above the long-term average, ranking in the warmest third on record for the state. Temperatures were above average across most of the state while parts of the Interior, south central Alaska and the Panhandle regions were near average for the season.
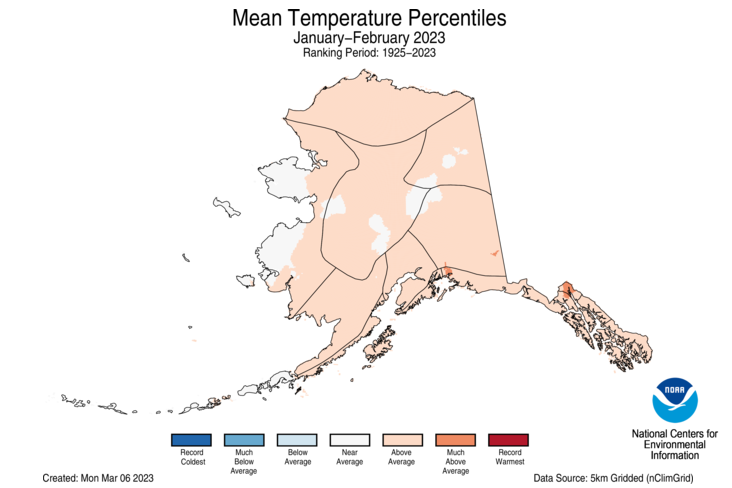
The Alaska January-February temperature was 8.5°F, 5.0°F above the long-term average, ranking in the warmest third of the record for the state. Above-average temperatures were observed across the vast majority of the state with parts of the Interior and Western Alaska experiencing near-normal temperatures for this two-month period.
Precipitation
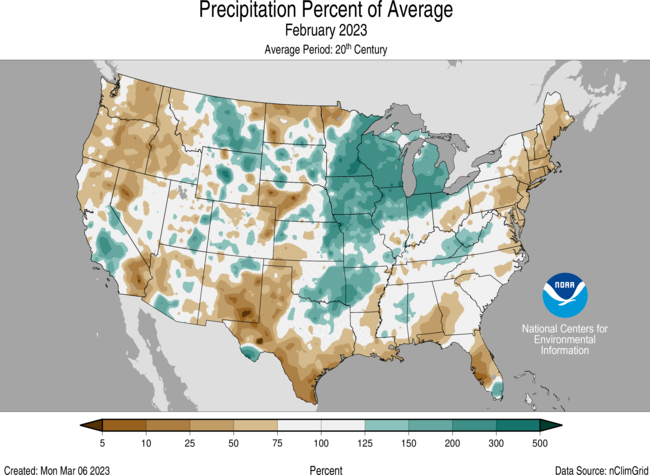
Precipitation was above average from the southern Plains to the Great Lakes and in parts of California, the Southwest, northern Plains and central Appalachia. Precipitation was below average across much of the Northwest, Northeast, and in parts of the Southwest, Gulf Coast, Plains and Southeast. Wisconsin ranked fifth wettest while Iowa and Michigan ranked eighth-wettest and 10th-wettest for February, respectively. On the dry side, Connecticut and Rhode Island both experienced their seventh-driest February while Massachusetts ranked as the eighth-driest February in the 129-year record.
The U.S. winter precipitation total was 7.69 inches, 0.90 inch above average, ranking in the wettest third of the December-February record. Precipitation was below average across parts of the Northwest, southern Plains, Mid-Atlantic and Southeast. Conversely, an abundance of precipitation fell during the winter season from California to the Great Lakes, and in parts of the Mississippi, Tennessee and Ohio river valleys, Northeast and interior Southeast. Wisconsin ranked wettest while Minnesota ranked second wettest and Iowa ranked fourth wettest on record for the season. Four additional states experienced a top-10 wettest event while no state experienced a top-10 driest winter.
The January-February precipitation total for the contiguous U.S. was 4.90 inches, 0.45 inch above average, ranking in the wettest third of the historical record. Precipitation was above average from California to the Upper Midwest, Mississippi and Tennessee river valleys, and in parts of the Ohio River Valley, Northeast and Southeast. Precipitation was below average across parts of the Northwest, northern Plains, Mid-Atlantic and Florida. Iowa ranked second wettest on record while Wisconsin ranked fourth and Nebraska ranked fifth wettest on record. North Dakota ranked ninth driest and Oregon ranked 11th driest for this two-month period.
Monthly precipitation averaged across the state of Alaska was 2.55 inches, ranking near-normal in the 99-year record. Conditions were wetter than average across the North Slope, West Coast, eastern Interior and in parts of the Aleutians and Panhandle. Much of the central Interior, south central Alaska and the remainder of the Aleutians and Panhandle experienced near-average conditions while parts of southeast Alaska experienced below-average precipitation for the month.
For the winter season, precipitation ranked near-average for Alaska with wetter-than-average conditions observed across much of the North Slope, West Coast, eastern Interior and in parts of the Aleutians while much of the central Interior, south central, Southeast regions and parts of the Aleutians experienced near average precipitation for this period.
The January-February precipitation ranked in the middle third of the 99-year record for Alaska, with above-average precipitation observed across much of the North Slope, West Coast, eastern Interior while the southern Panhandle was much wetter-than-average. The central Interior and parts of the Southwest and Southeast were near-average while the Northwest Gulf and parts of the Aleutians experienced below-average precipitation during this period.
Other Notable Events

On February 3-4, a polar vortex accompanied by powerful winds swept across portions of the Northeast resulting in dangerously low temperatures, power outages and canceled flights.
- On February 3, the temperature at Mount Washington dropped to -47°F with a wind chill of -108°F – the coldest wind chill ever recorded for the United States.
- On February 4, Boston, Massachusetts set a new record low when temperatures dropped to -10°F at Logan International Airport. The previous record of -2°F was set in 1886.
- On February 4, Portland, Maine recorded its all-time lowest wind chill at -45°F.
February had several notable weather systems that brought severe thunderstorms and an unusually high number of tornadoes to portions of the United States.
- On February 8-9, a tornado outbreak occurred across portions of Louisiana, Alabama and the Florida Panhandle. A total of 10 tornadoes was confirmed by the National Weather Service, including two EF-2 tornadoes.
- On February 16-17, a tornado outbreak occurred across portions of the South. A total of 13 tornadoes, including two EF-2 tornadoes, was confirmed by the National Weather Service. The tornadoes caused damage to portions of Arkansas, Mississippi, Tennessee and Georgia.
- On February 21, an EF-2 tornado hit parts of central New Jersey, inflicting damage to an apartment complex in the suburbs of Trenton. This is the first February tornado to hit the state since 1999 and only the fifth since 1950.
- On February 26-27, a tornado outbreak occurred across portions of the South and Midwest. A total of 27 tornadoes, including three EF-2 tornadoes, was confirmed by the National Weather Service. The tornadoes caused damage to portions of Texas, Oklahoma, Kansas, Missouri, Illinois, Indiana and Ohio. A total of 11 of these confirmed tornadoes occurred in Oklahoma on February 26 – the highest number of tornadoes in February for the state since records began in 1950.
A rare winter storm dumped heavy snow and record rainfall on portions of Southern California, prompting the National Weather Service to issue the first blizzard warning for the region since 1989.
Ice cover in the Great Lakes was at a record low during mid-February with lake coverage at 7.5%, well below the historic average of 41%. By the end of February, ice cover increased to 14% of the Great Lakes, well below the historic average of 42%.
Water levels at Lake Powell – the nation’s second-largest reservoir – dropped to record lows in February, raising concerns for millions of Americans that rely on that system.
Drought
According to the February 28 U.S. Drought Monitor report, about 38.5% of the contiguous U.S. was in drought, down about 4.2% from the end of January. Drought conditions expanded or intensified across portions of the Pacific Northwest, central Rockies, southern Plains, and Southeast. Drought contracted or was eliminated across large parts of the West and Plains, and portions of the Great Lakes, Southeast and Hawaii.
Monthly Outlook
According to the February 28 One-Month Outlook from the Climate Prediction Center, areas from the southern Plains to the south Atlantic and much of western Alaska and the Alaska Peninsula favor above-normal monthly mean temperatures in March, with the greatest odds in Florida. The best chances for below-normal temperatures are forecast from the West Coast to the Northeast and in southeast Alaska. Much of the western U.S., northern Plains and Midwest as well as western Alaska are favored to see above-normal monthly total precipitation. Below-normal precipitation is most likely to occur across portions of the Upper Midwest and southeast Alaska. Drought improvement or removal is forecast for much of California and the Great Basin, while persistence is more likely for parts of the Pacific Northwest, northern Rockies, and Great Plains. Drought development is likely across the Florida Peninsula and parts of Texas.
According to the One-Month Outlook issued on March 1 from the National Interagency Fire Center, portions of New Mexico, Texas, Georgia and Florida have above normal significant wildland fire potential during March, while the Tennessee River Valley and parts of the Mississippi River and Ohio River valleys are expected to have below normal potential for the month.
This monthly summary from NOAA National Centers for Environmental Information is part of the suite of climate services NOAA provides to government, business, academia and the public to support informed decision-making. For more detailed climate information, check out our comprehensive February 2023 U.S. Climate Report scheduled for release on March 13, 2023.
Much more:
Here are some “ET’s” recorded from around the planet the last couple of days, their consequences, and some extreme temperature outlooks, as well as any extreme precipitation reports:
Here is some more new February 2023 climatology:
Here is more climate and weather news from Wednesday:
(As usual, this will be a fluid post in which more information gets added during the day as it crosses my radar, crediting all who have put it on-line. Items will be archived on this site for posterity. In most instances click on the pictures of each tweet to see each article. The most noteworthy items will be listed first.)
If you like these posts and my work please contribute via the PayPal widget, which has recently been added to this site. Thanks in advance for any support.)
Guy Walton… “The Climate Guy”